Estrogen Regulation of Gonadotropin Subunit(GPÃÆà ½Ãâñ, FSHÃÆà ½Ãâò, LHÃÆà ½Ãâò) mRNA Expression duringSexually Quiescent and Breeding Phases in the Female Catfish Heteropneustes fossilis
Acharjee A, Chaube R and KP Joy
Acharjee A, Chaube R and Joy KP*
Department of Zoology, Centre of Advanced Study, Banaras Hindu University, Varanasi-221005, India
- *Corresponding Author:
- Joy KP
Department of Biotechnology
Cochin University of Science and Technology, Kochi-682022, India
Tel: +918281274891
E-mail: kpjoybhu@gmail.com
Received Date: September 17, 2016; Accepted Date: September 29, 2016; Published Date: October 04, 2016
Citation: Acharjee A, Chaube R, Joy KP. Estrogen Regulation of Gonadotropin Subunit (GPα, FSHβ, LHβ) mRNA Expression during Sexually Quiescent and Breeding Phases in the Female Catfish Heteropneustes fossilis. J Transl Neurosci. 2016, 1:2.
Copyright: © 2016 Acharjee A, et al. This is an open-access article distributed under the terms of the Creative Commons Attribution License, which permits unrestricted use, distribution, and reproduction in any medium, provided the original author and source are credited.
Abstract
Estrogens exert a feedback control on gonadotropin (GtH) secretion at the level of the hypothalamus and pituitary. In the present study, female catfish were ovariectomized (OVX) for 5 weeks in resting (December-January) and preparatory (March-April) phases and supplemented with estradiol-17β (E2, 0.05 and 0.5 µg/g body mass) in 3-week ovariectomized fish to demonstrate the nature of feedback control on expression of pituitary GtH subunit (glycoprotein α - GPα, follicle- stimulating hormone - FSHβ and luteinizing hormone - LHβ) genes. Plasma steroid hormone (E2, testosterone, P4 and cortisol) levels were monitored concurrently. Plasma levels of E2, testosterone and P4 decreased after OVX but cortisol increased initially but later decreased. The E2 treatment elevated plasma E2 levels significantly in the OVX groups dose-dependently but not testosterone, P4 and cortisol levels. Ovariectomy produced season-dependent effects on GPα, FSHβ and LHβ transcript levels. In the resting phase, OVX led to an increase in the expression of FSHβ up to week 4, which then declined on week 5 with the level still higher than the sham-OVX fish. LHβ did not show any change after OVX. GPα showed a pattern similar to the FSHβ expression. In the preparatory phase, both FSHβ and GPα transcripts increased throughout OVX compared to the control group. However, the LHβ transcripts decreased significantly in the OVX group. In the resting phase, E2 replacement in 3-week OVX fish not only reversed the OVX effect on GPα and FSHβ transcript levels, but also decreased the expression below the control level (0.05µg E2) or further down (0.5 µg E2). The LHβ expression did not show any significant change in the resting phase. In the preparatory phase, the GPα and FSHβ expression altered similarly as in the resting phase. The LHβ expression was up regulated after the E2 replacement. The data suggest that E2 modulates transcriptional activity of FSHβ and LHβ differentially depending on the reproductive status of the fish.
Keywords
Catfish; Estrogen feedback; Gonadotropin subunit; Gene expression; Quantitative PCR; Plasma steroid hormones
Introduction
It is well established that gonadal steroids exert a feedback control on pituitary gonadotropin (FSH and LH) secretion across vertebrates. In seasonally breeding animals like teleosts, the nature of the feedback action varies with species, sex and the stage of gonadal development. The feedback may be positive or negative, acting directly on the pituitary or indirectly on the brain [1-8]. The feedback relationships are generally demonstrated by gonadectomy and steroid-replacement experiments. In many species, gonadectomy at late stages of recrudescence increases LH secretion: African catfish (Clarias gariepinus) [9], goldfish [10], stinging catfish (Heteropneustes fossilis) [11], Atlantic croaker [12], Mediterranean sea bass (Dicentrarchus labrax) [13], hybrid striped bass [14], and salmonids [15,16]. These effects were reversed by treatment with testosterone and/or E2 [10,12,14,15,17]. The feedback control of FSH is more complex than that of LH; in Atlantic male salmon parr-II, the FSH secretion is controlled by both aromatase-dependent and aromataseindependent mechanisms while the LH secretion is controlled by an aromatase-dependent mechanism [5]. In male hybrid tilapia, both reproductive stage and concentrations are important determinants of differential regulation of LH and FSH [4,7].
The feedback control of gonadal steroids on GtH secretion is relayed through central regulatory mechanisms, notably gonadotropin-releasing hormone (GnRH), monoamines and kisspeptins [18-23]. Since estrogen receptors are not present on GnRH neurons [24], E2 modulates GnRH activity indirectly through receptors present in a subpopulation of preoptic neurons innervating the pituitary that express tyrosine hydroxylase (dopamine, DA) neurons [25]. DA inhibits GnRH secretion at the level of the hypothalamus by DA-I receptors and GnRH-induced LH release at the level of the pituitary by DA-2 receptors [18-20]. Another route by which the negative feedback could operate is the up-regulation of dopamine receptor mRNA by E2 as seen in the pituitary of tilapia [20]. Gonadal steroids modulate GnRH activity through kisspeptin (kiss1 and kiss2) neuronal systems, which are sensitive to gonadal steroids [21,26,27]. In medaka, ovariectomy significantly reduced the number of kiss1 neurons in the nucleus ventralis tuberis and E2 completely reversed this effect, suggesting a positive feedback control [21]. In juvenile zebrafish, E2 caused an increase in number of kiss2 neurons in the hypothalamus, and a significant increase in brain kiss1 mRNA and gpr54-2b, expression [27]. These observations are also in agreement with the effect of estrogen response elements on the promoter and 5' flanking regions of LHβ and FSHβ subunits of salmon [28] and tilapia [29].
In catfishes, the duality of gonadotropins, unlike in other teleosts, is still debated since the presence of a native FSH protein is not yet detected [30,31]. Interestingly, cDNAs of both FSHβ- and LHβ- subunits were isolated in African catfish, channel catfish (Ictalurus punctatus) and Southern catfish (Silurus meridionalis) [32-34]. In the catfish H. fossilis, an E2 feedback control of LH secretion through an interaction with hypothalamic monoaminergic system (catecholamines and serotonin) was previously reported [11,35,36]. OVX elicited a bimodal effect on plasma LH with the peak rise in week 4 and a low dose E2 (0.1 μg/g body weight) in 3-week OVX fish restored the LH level and the higher steroid doses inhibited it. However, no information is available on FSH dynamics. Recently, we cloned and characterized both FSHβ and LHβ cDNAs in the stinging catfish [37], making it now possible to study simulataneously both FSH and LH regulation and functions. In the catfish, FSHβ and LHβ transcripts showed distinct seasonal patterns, implying a differential control by regulatory mechanisms. External factors like photoperiod and temperature, and internal factors like gonadal steroids act on the central regulatory systems to synchronize GtH seasonal and temporal patterns.
In the present study, the expression of GPα, FSHβ and LHβ subunit genes was studied in ovariectomized and estrogenreplaced catfish in gonad resting and early recrudescent phases to demonstrate the nature of estrogenic control.
Materials and Methods
Heteropneustes fossilis is a freshwater air-breathing catfish whose reproductive cycle can be divided into five phases: resting (November–January), preparatory (February–April), prespawning (May–June), spawning (July–August) and postspawning (September–October) phases.
Animal collection and acclimatization
Adult female H. fossilis (30–35 g) were collected from local fish markets in Varanasi in the resting phase (second week of December) with quiescent ovary and in the preparatory phase (second week of March) with pre-vitellogenic ovary. They were maintained in flow-through aquarium tanks under a normal photoperiod and ambient temperature (Resting phase: 10.5 h light: 13.5 h darkness, 18 ± 2°C; preparatory phase: 12.5 L:11.5D, 25 ± 2°C) for two weeks prior to the start of the experiment in order to overcome stress due to transportation and fed ad libitum with boiled goat liver. All experiments were performed in accordance with the guidelines of the Animal Ethics Committee, Faculty of Science, and Banaras Hindu University.
Chemicals and reagents
The following molecular biology kits and reagents were used: RNeasy lipid tissue mini kit (Qiagen GmBH, Germany), Revert- Aid H minus first strand cDNA synthesis kit (Fermentas, Hanover, MD, USA), DNase I RNase-free (Ambion Inc., Austin, TX, USA), RNAlater (Ambion Inc., Austin, TX, USA), 2X PCR master mix (Fermentas, Hanover, MD, USA), 2X VeriQuest SYBR Green qPCR Master Mix Ex (Cleveland, Ohio, USA), The primers used in the present study were synthesized by Integrated DNA Technologies (Coralville, IA, USA). Other chemicals used in the study were of molecular biology grade and purchased from E. Merck, Mumbai, India. Estradiol-17β (No. E-2031), testosterone (No. AA E-1300), progesterone (No. FR E-2500) and cortisol (No. MS E-5000) ELISA kits were purchased from Labor Diagnostika Nord GmbH & Co. KG, Germany. Degassed and filtered nanopure water (Barnstead International, Dubuque, and IO, USA) was used throughout for the ELISA. Estradiol-17β used in the study was purchased from Sigma Aldrich (St. Louis, MO, USA).
Experiments
Ovariectomy
For ovariectomy, the acclimated fish were anaesthetized by spraying tricaine methanesulfonate (MS222) (100 mg/250 mL distilled water) over the gills. Approximately a 3-4 cm long midventral incision was made anterior to the urogenital pore with a sterilized scalpel to expose the paired ovary. The ovaries were carefully detached from the peritoneal covering and removed. The cut end of the oviduct was cauterised with a hot needle to prevent regeneration and the incision was sutured with silk thread. The fish were treated with benzanthine penicillin (16000 IU/L of water) for 3-5 days to prevent skin infection. For shamovariectomy, all the above steps were followed except that the ovaries were not removed. The operated fish were maintained for 1-5 weeks. Mortality of operated and sham-operated fish was negligible (<3%). Completeness of ovariectomy and regeneration of gonads, if any, were checked by examining the peritoneal cavity of the fish at the time of sampling. Only tissues from completely ovariectomized fish were used for experimentation. For sampling, the fish were anaesthetized by spraying MS222 over the gills. Blood was collected by caudal puncture by using heparinized syringes for separation of plasma for steroid assays. The fish were sacrificed by decapitation and pituitaries were dissected out immediately and transferred to RNA later. The pituitaries were stored at -80°C.
E2 supplementation
Three-week ovariectomized and sham-ovariectomized fish in both the resting and preparatory phases were injected with E2 intraperitoneally in dosages of 0.05 and 0.5 μg/g body mass. The fish were given E2 daily for 3 days. Five groups each of ovariectomized and sham-ovariectomized fish were given an equal volume (0.1 mL) of vehicle (propylene glycol) as controls. After 18 h of the last injection, the fish were anaesthetized by spraying MS222 over the gills. Blood was collected by caudal puncture by using heparinized syringes for collection of plasma for steroid assays. The fish were sacrificed by decapitation and pituitaries were dissected out immediately and transferred to RNA later. The pituitaries were stored at -80°C.
QPCR assay
The pituitaries from each group (15 pituitaries pooled to make one sample; n=5) were homogenized using a T10 basic ULTRATURRAX homogeniser (IKA, Germany) in 1 mL QIAZOL (Qiagen) buffer and total RNA was isolated with RNeasy Lipid Tissue Mini Kit (Qiagen).Total RNA was treated with 2U DNaseI RNasefree (Ambion) for 30 min at 37°C, following the manufacturer’s protocol. The quality of RNA was analyzed after separation on a 1% agarose gel containing 2.2 M formaldehyde. The total RNA yield was determined by a NanoDrop (ND-1000 Spectrophotometer; NanoDrop Technologies, Rockland, DE). The RNA samples with an A260/A280 ratio from 1.6 to 2.0 were used in the cDNA synthesis reaction. For reverse transcription (RT), 1 μg of total RNA of each sample was reverse transcribed in a 20 μL reaction with the RevertAid H Minus First Strand cDNA Synthesis Kit (Thermo Scientific), following the manufacturer's protocol. Briefly, in a sterile nuclease-free tube on ice, the following reagents were added: total RNA template (1 μg), 1 μL of random hexamer primer (100 pM) and nuclease-free water to 12 μL. After mixing gently and centrifuging briefly, the mixture was incubated at 65°C for 5 min. Then it was chilled on ice, spinned down and the vial placed back on ice to add 4 μL of 5X reaction buffer, 1 μL of RiboLock RNase Inhibitor (20 U/μL), 2 μL of 10 mM dNTP Mix and 1 μL of RevertAid H Minus M-MuLV Reverse Transcriptase (200 U/μL). The mixture was incubated for 5 min at 25°C, followed by 60 min at 42°C. The reaction was terminated by heating at 70°C for 5 min and cDNA was stored at -80°C.
Transcripts encoding GtH subunit genes were amplified using real time qPCR. The real time qPCR was done with an ABI Prism 7500 Sequence Detection System (PE Applied Biosystems, CA, USA). The PCR reaction mixture (20 μL) contained 1 μL sample cDNA (diluted 1:10), 1 μL 10 pM forward and reverse primers (Table 1) and 10 μL 2X VeriQuest SYBR Green qPCR Master Mix Ex (Cleveland, Ohio, USA). The PCR condition was: 95°C for 30 s, followed by 40 cycles at 95°C for 5 s, and 60°C for 20 s. The PCR amplicons were 157 bp for β-actin, 132 bp for GPα, 136 bp for FSHβ, and 128 bp for LHβ. The specific amplification of each cDNA was verified by melting curve analysis and gel electrophoresis of the PCR product on a 3% agarose gel and visualized with ethidium bromide in addition to sequencing of qPCR products. In each assay, sample cDNAs were amplified in duplicate. A non-template control and dissociation curve were performed to ensure that only one PCR product was amplified and that stock solutions were not contaminated. A cDNA synthesis sample without reverse transcriptase (no RT control to check genomic DNA contamination) was tested for all the genes and no amplification was detected. β-actin was taken as the reference gene as its expression in the pituitary was found to be consistent throughout the seasons. PCR efficiency for each gene was measured using serial dilutions of stock cDNA. The amplification efficiencies of all the genes were approximately equal and ranged from 95% to 103%. Cycle threshold was obtained from the exponential phase of PCR amplification and the expression of GtH subunit mRNAs were normalized to the expression of β-actin mRNA. The relative expression levels were calculated using the 2-ΔΔCt method, where the control pituitary cDNA was taken as the calibrator.
| Experiment | Primer Name | Sequence 5’-3’ |
|---|---|---|
| Gene-specific primers for qPCR | qPCR GPα Forward Primer | CCAACTCCCTTGAGGTCCAAGAA |
| qPCR GPα Reverse Primer | GCAGTCTGTGTGATTCACCAGC | |
| qPCR FSHβ Forward Primer | ATCACCGTGGAGAGTGACGAG | |
| qPCR FSHβ Reverse Primer | CCCTGAAGTTACAGGTGTTCTGG | |
| qPCR LHβ Forward Primer | CTGAGCGATCACGGCAAAAGCT | |
| qPCR LHβ Reverse Primer | CGGTCTCATTCACAGGTTGGCA | |
| Internal Control | β-actin Forward Primer | TGGCCGTGACCTGACTGAC |
| β-actin Reverse Primer | CCTGCTCAAAGTCAAGAGCGAC |
Table 1: List of primers used for qPCR assay.
Steroid extraction and assay
Plasma steroids were extracted with 3 vol of diethyl ether, three times. The ether phase was collected and pooled group-wise, evaporated and dried under N2 gas and stored at -200°C till estimation. The steroids were assayed by specific ELISA kits for E2, testosterone, P4 and cortisol (Labor Diagnostika Nord GmbH & Co. KG, Germany) according to the manufacturer’s instructions. The details of E2 and testosterone assays were described earlier [31]. The details of P4 and cortisol assays are briefly described.
P4 assay: Briefly, 25 μL each of P4 standard (0, 0.3, 1.0, 5.0, 20.0, 60.0 ng/mL) and samples were transferred to the anti- P4-Immunoglobulin G-coated plate. The immunoreaction was started by adding 100 μL of P4-HRP conjugate solution into each well, followed by incubation at 37°C for 1 h. The content from each plate was removed and washed with 300 μL of distilled water, 5 times. Water was completely drained out from each well. Next 150 μL of TMB substrate was dispensed into each well and incubated at room temperature for 10-15 min in dark. Color development was stopped by adding 50 μL of stop solution (1 mol/L sulphuric acid). Absorbance was taken at 450 nM using a Multiscan microplate reader (Thermo Electron Corporation, USA).
Cortisol assay: Briefly, 20 μL each of cortisol standard (0, 0.5, 2.0, 5.0, 10.0, 30.0, 60.0 μg/dL) and samples were transferred to the anti-Cortisol-Immunoglobulin G-coated plate. The immunoreactions were started by adding 100 μL of cortisol-HRP conjugate solution into each well, followed by incubation at 37°C for 45 min. The content from each plate was removed and washed with 300 μL of distilled water, 5 times. Water was completely drained out from each well. Next 150 μL of TMB substrate was dispensed into each well and incubated at room temperature for 15-20 min in dark. Color development was stopped by adding 50 μL of stop solution (1 mol/L sulphuric acid). Absorbance was taken at 450 nM using a Multiscan microplate reader (Thermo Electron Corporation, USA).
Validation of P4 and cortisol assays: The response–concentration curves for P4 and cortisol were linear over 0.1–60 ng/mL and 0.5-60 μg/dL range, respectively. The sensitivity of the P4 and cortisol assays was 0.1 ng/mL and 0.4 μg/dL, respectively. Cross reactivity of the P4 antibody was P4—100%, 11-OHP–100%, 17-OHP—0.4%, Deoxycorticosterone–1.7%, 17, 20β-DP— 4.6%, E2—0%, testosterone—0.0004%, corticosterone–0.3%, pregnenolone–0.2%, 5-α-Androstan-3β, 17β-diol–0.3% and cortisol—0%. Cross reactivity of the cortisol antibody was Cortisol—100%, predinsolone–13.6%, corticosterone–7.6%, Deoxycorticosterone–7.2%, P4–7.2%, cortisone–6.2%, deoxycortisol–5.6%, pednisone–5.6%, dexamethasone–1.6%, 17-OHP—0%, 17,20β-DP—7.6%, E2—0%, testosterone—0% and pregnenolone–0%. For percentage recovery, known concentrations of P4 and cortisol were processed in the same manner as samples. The percentage recovery of P4 (15.4 ng/mL added) was 97 ± 2% (n=5). The percentage recovery of cortisol was 93.8 ± 1.6% (n=5) (15.3 μg/dL added). The coefficients of inter- and intra-assay variations were 10.4%, 11.4% for P4 and 5.6%, 5.76% for cortisol, respectively.
Statistical analysis
The steroid levels are presented as mean ± SEM (n=5). Gene expression studies were replicated five times with five different batches of fish. The cycle threshold (Ct) value of catfish GPα, FSHβ and LHβ mRNA level was normalized with the Ct value of β-actin for each sample. The control sample was taken as the calibrator to give a relative ratio of the mRNA expression. Data are presented as mean of Log RQ ± SEM. The data were checked for homogeneity and normality and further analyzed for statistical significance using the Statistical Package for the Social Sciences software program (version 10.0; SPSS). One way analysis of variance (ANOVA, P<0.001), followed by Tukey’s test was used to compare differences at a significance level of P<0.05.
Results
Effects of OVX on plasma steroids and GtH subunit gene expression
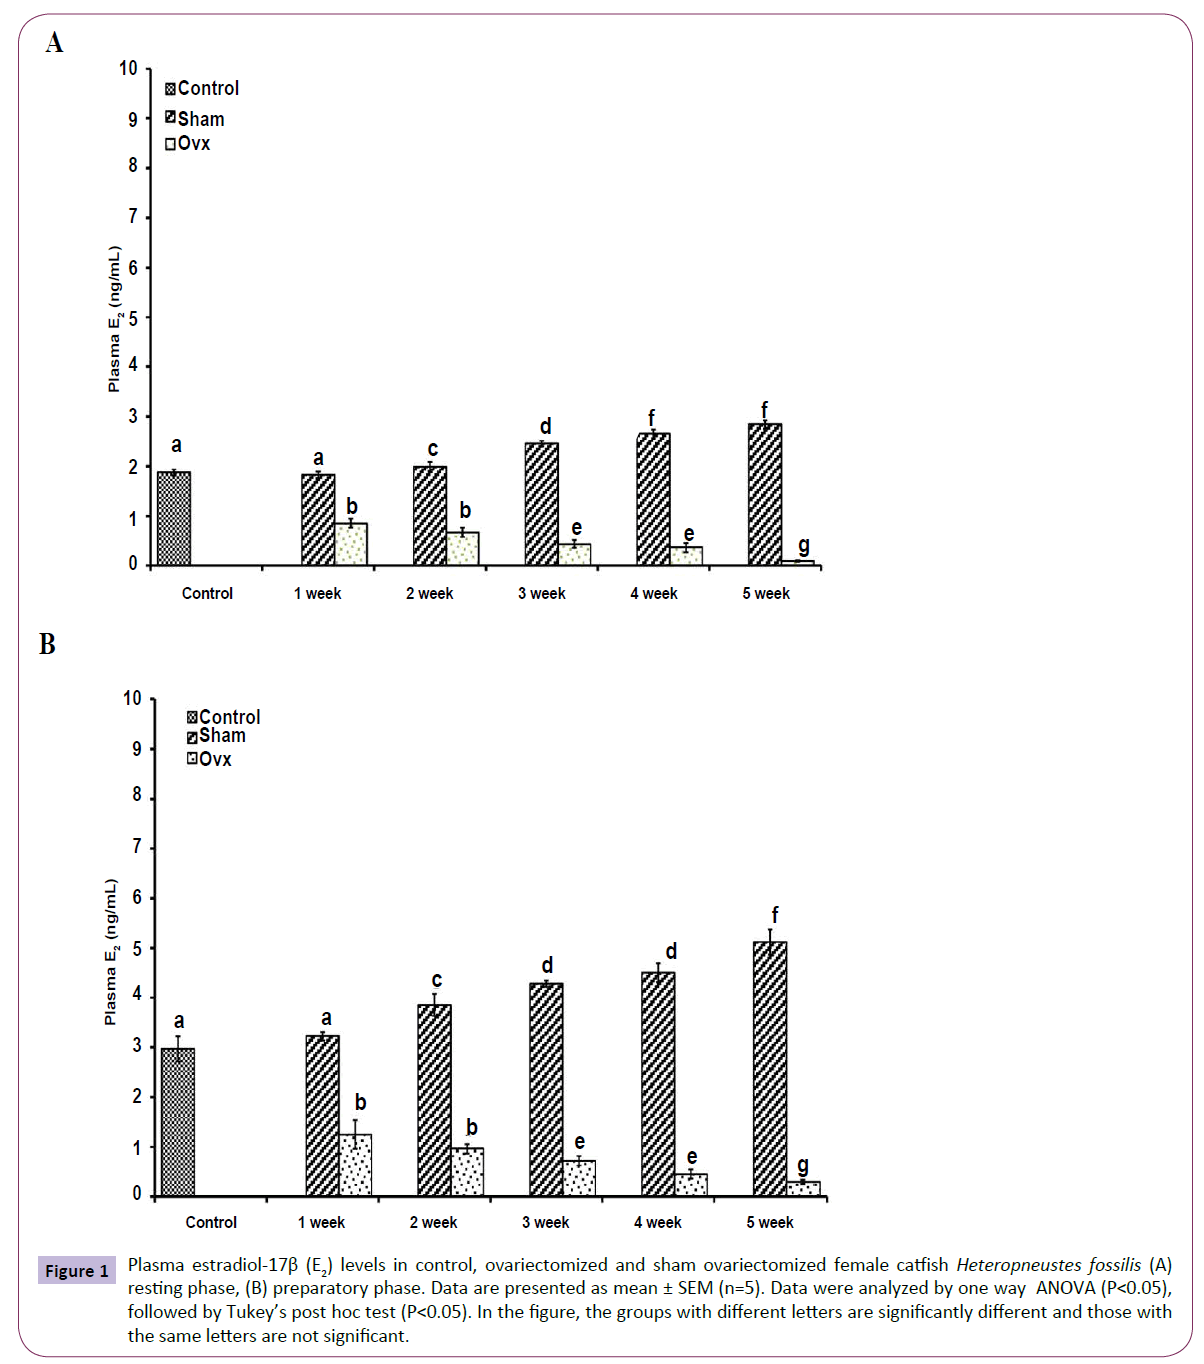
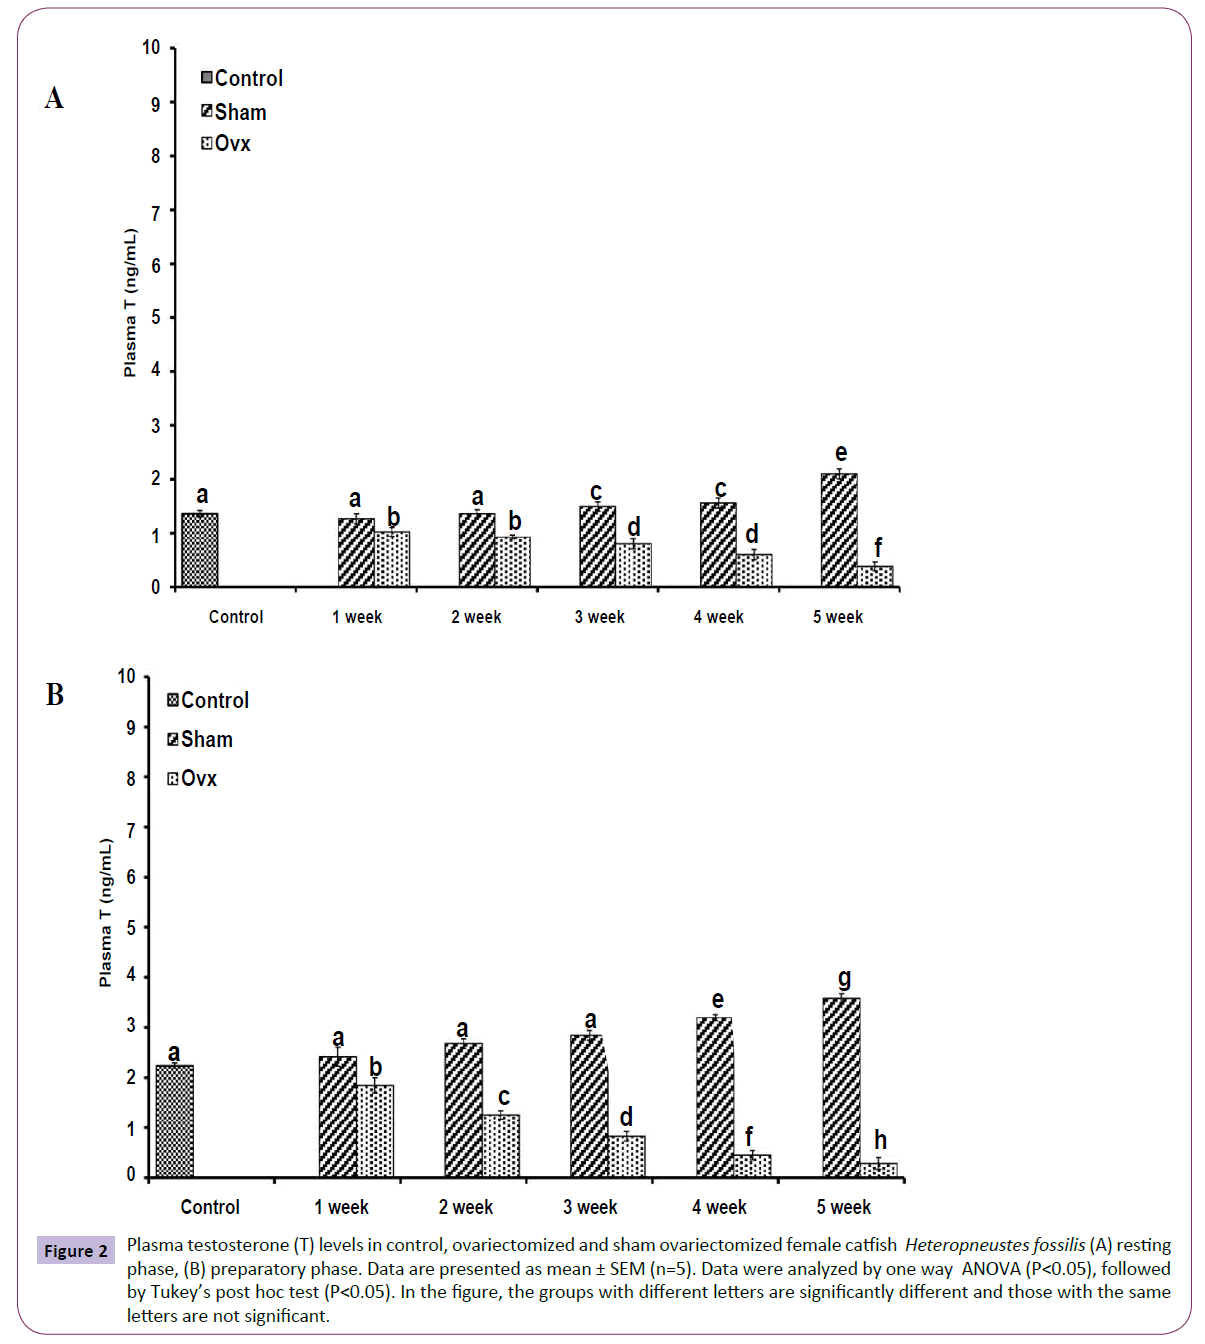
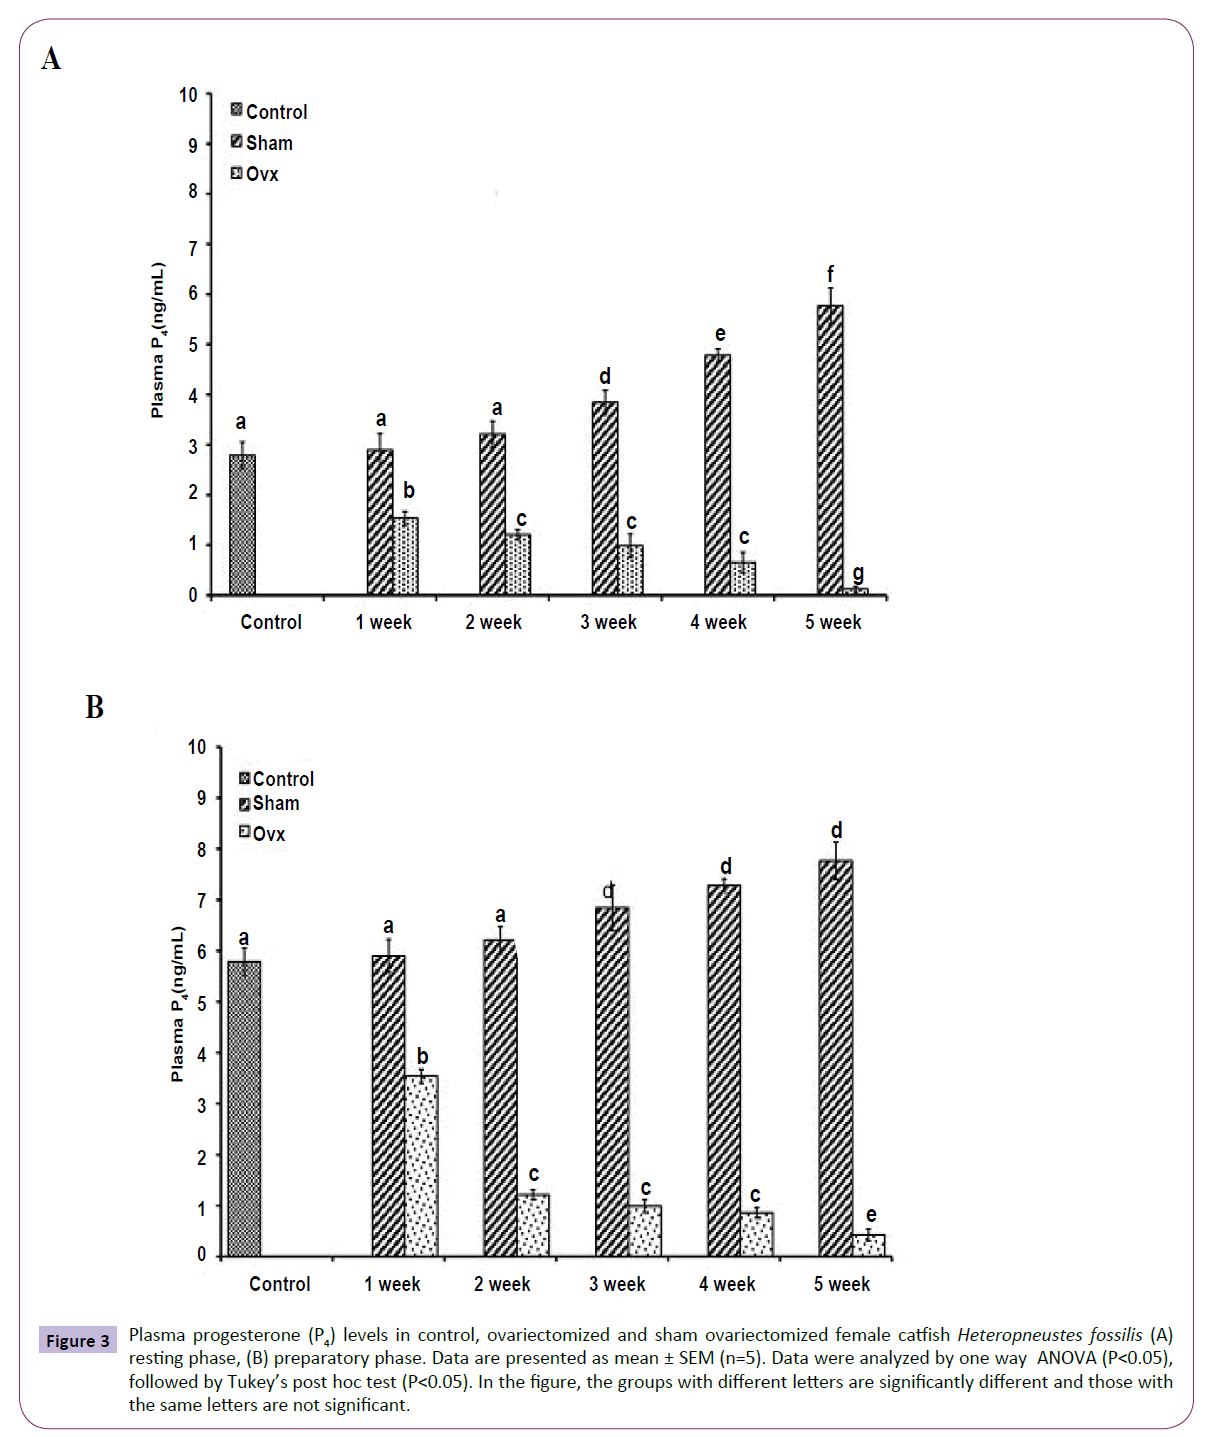
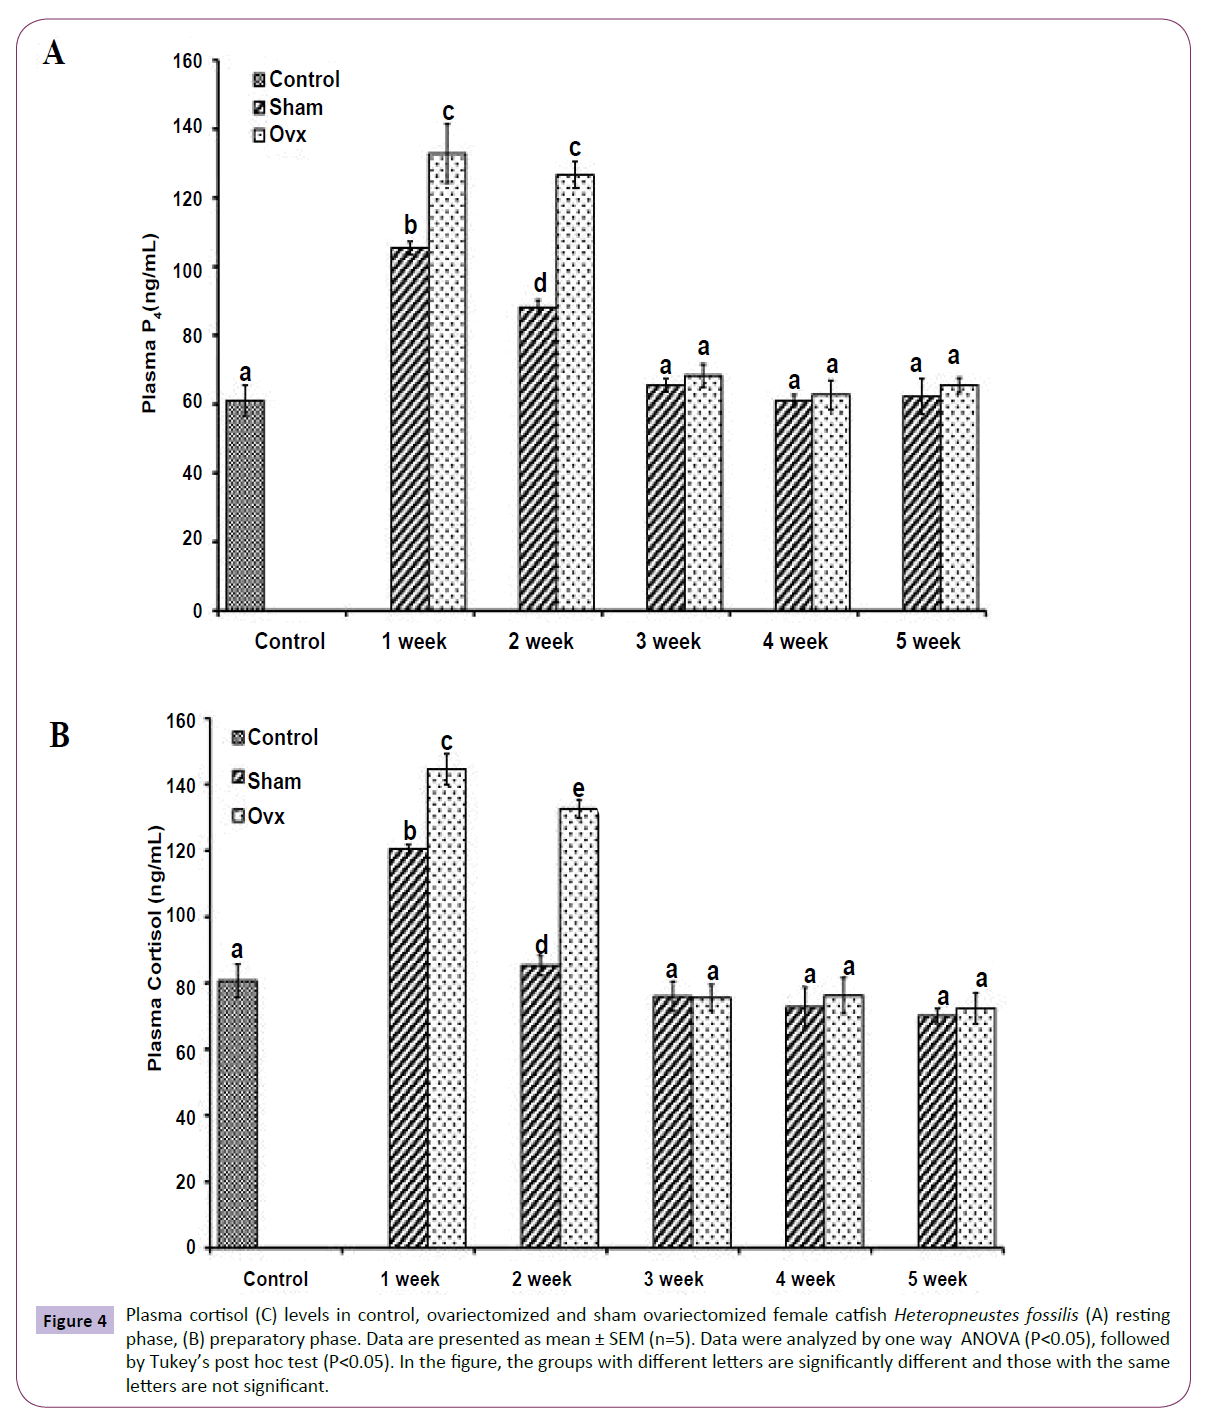
OVX caused overall significant effects on plasma steroid levels (one way ANOVA, P<0.001) in resting (FE2=156.04, FTestosterone=75.63; FP4=114.65, FCortisol=211.50 and preparatory (FE2=148.25, FTestosterone=213.85, FP4=174.32 and FCortisol=226.05) phases. Plasma E2 levels decreased significantly from the first week onwards and reached the lowest level in the fifth week (Figures 1A and 1B). The sham-OVX fish showed a gradual increase in the plasma E2 level. Plasma testosterone (Figures 2A and 2B) and P4 (Figures 3A and 3B) also decreased time-dependently. On the other hand, plasma cortisol levels increased in the first and second weeks of OVX and sham-OVX in both phases, significantly higher in the OVX groups. However, cortisol levels decreased in both OVX and Sham-OVX groups without any significant effect in week 3, 4 and 5 (Figures 4A and 4B).
Figure 1 Plasma estradiol-17β (E2) levels in control, ovariectomized and sham ovariectomized female catfish Heteropneustes fossilis (A) resting phase, (B) preparatory phase. Data are presented as mean ± SEM (n=5). Data were analyzed by one way ANOVA (P<0.05), followed by Tukey’s post hoc test (P<0.05). In the figure, the groups with different letters are significantly different and those with the same letters are not significant.
Figure 2 Plasma testosterone (T) levels in control, ovariectomized and sham ovariectomized female catfish Heteropneustes fossilis (A) resting phase, (B) preparatory phase. Data are presented as mean ± SEM (n=5). Data were analyzed by one way ANOVA (P<0.05), followed by Tukey’s post hoc test (P<0.05). In the figure, the groups with different letters are significantly different and those with the same letters are not significant.
Figure 3 Plasma progesterone (P4) levels in control, ovariectomized and sham ovariectomized female catfish Heteropneustes fossilis (A) resting phase, (B) preparatory phase. Data are presented as mean ± SEM (n=5). Data were analyzed by one way ANOVA (P<0.05), followed by Tukey’s post hoc test (P<0.05). In the figure, the groups with different letters are significantly different and those with the same letters are not significant.
Figure 4 Plasma cortisol (C) levels in control, ovariectomized and sham ovariectomized female catfish Heteropneustes fossilis (A) resting phase, (B) preparatory phase. Data are presented as mean ± SEM (n=5). Data were analyzed by one way ANOVA (P<0.05), followed by Tukey’s post hoc test (P<0.05). In the figure, the groups with different letters are significantly different and those with the same letters are not significant.
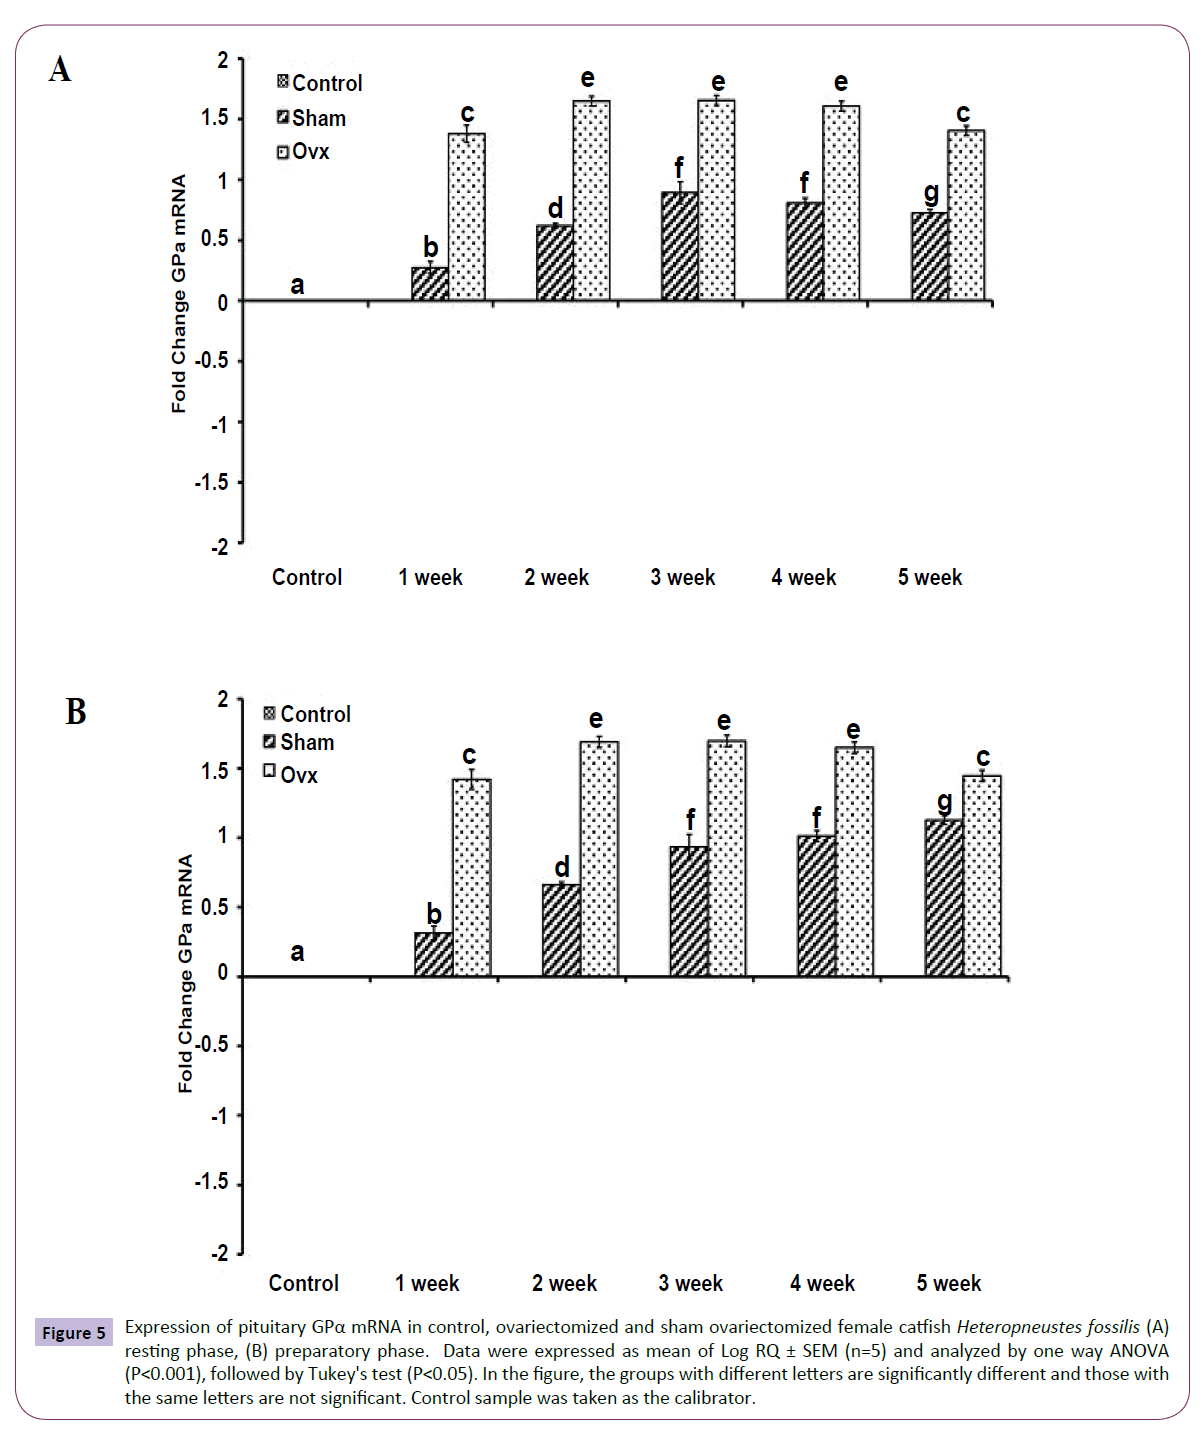
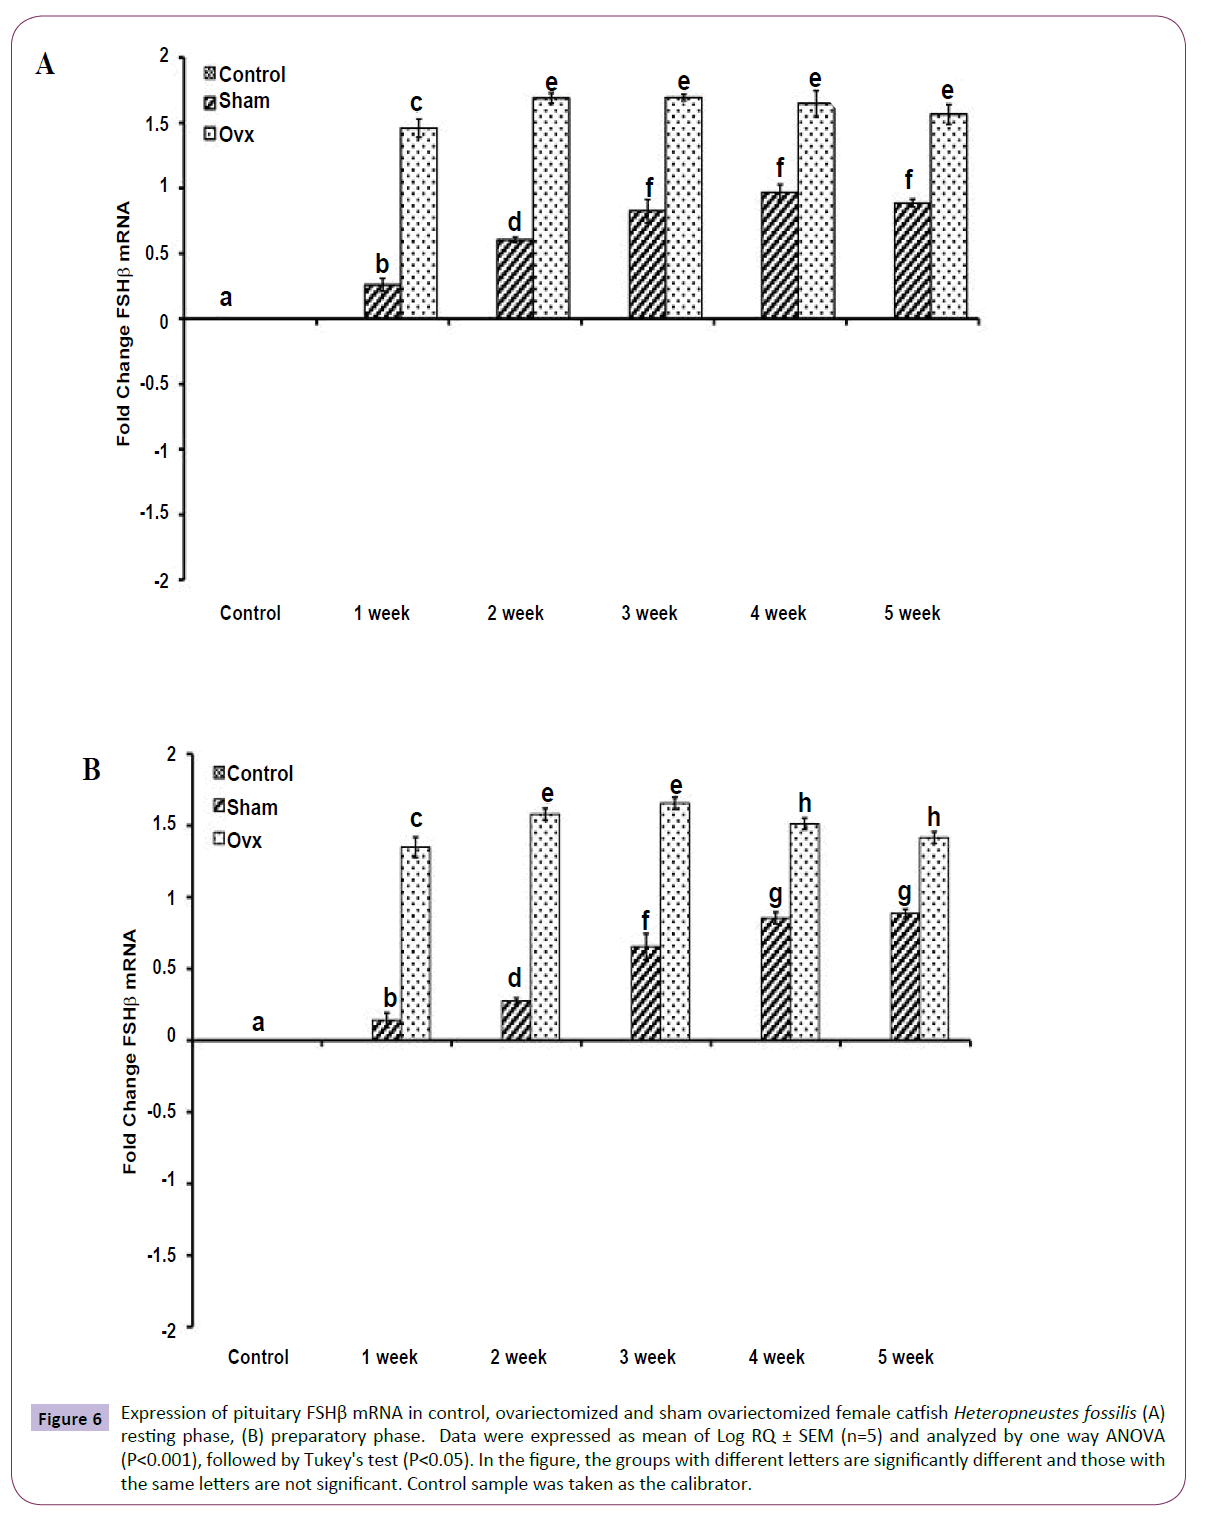
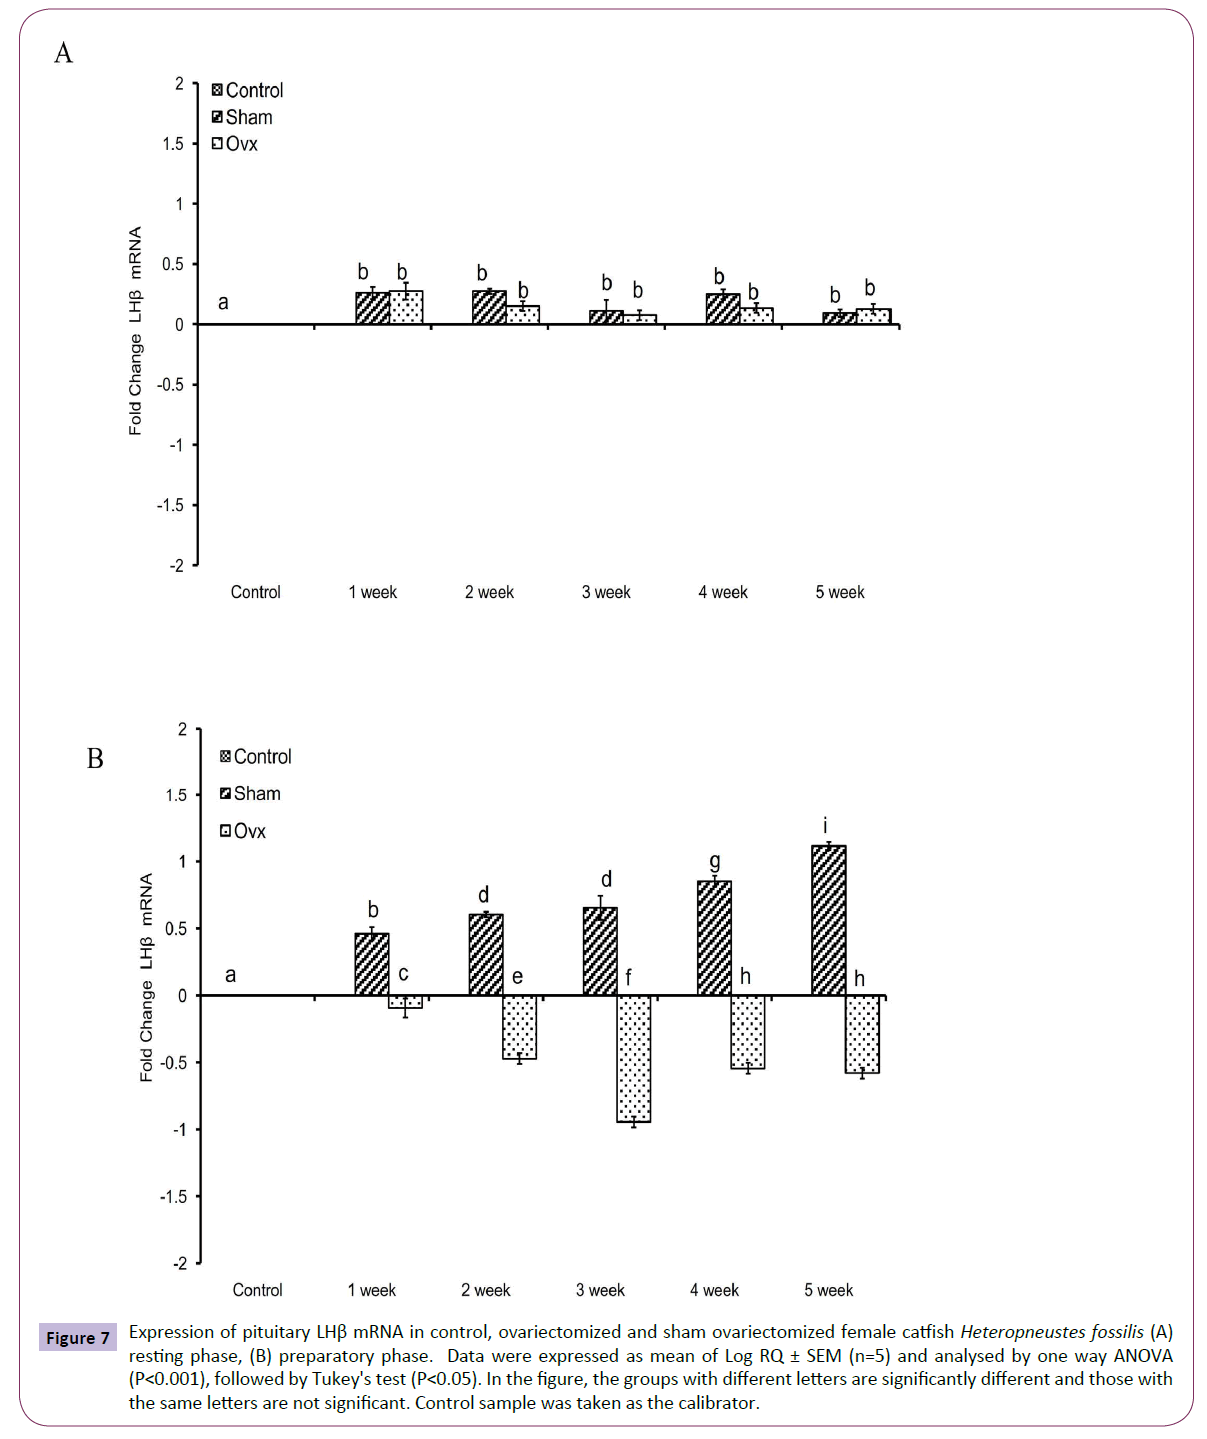
OVX produced significant effects on the expression of the GtH subunit genes GPα, FSHβ and LHβ in the resting (Figures 5A, 6A and 7A); (P<0.001, one way ANOVA, FGPα=226.05, FFSHβ=246.29 and FLHβ=5.82) and preparatory (Figures 5B and 6B); (P<0.001, one way ANOVA, FGPα=222.88, FFSHβ =251.39 and FLHβ=315.43) phases. In the sham groups, GPα expression increased with up to week 4 in the preparatory phase and time-dependently in the preparatory phase (Figures 5A and 5B). OVX increased the expression at all duration till week 4 and then decreased in week 5. The fold increase was higher in week 1 and decreased over time so that it was the lowest in week 5 in the preparatory phase. FSHβ expression followed a similar pattern in the OVX groups with the peak expression in week 4 in the resting phase and week 3 in the preparatory phase (Figures 6A and 6B). The fold increase was the highest in week 1 and decreased with time in both phases in relation to the sham groups. LHβ expression did not vary significantly in the sham or OVX groups in the resting phase (Figure 7A). In the preparatory phase, however, LHβ expression was inhibited in a biphasic manner in the OVX groups with the peak inhibition in week 3 and the inhibitory trend decreased with time subsequently (Figure 7B). In sham groups, the LHβ expression increased with time.
Figure 5 Expression of pituitary GPα mRNA in control, ovariectomized and sham ovariectomized female catfish Heteropneustes fossilis (A) resting phase, (B) preparatory phase. Data were expressed as mean of Log RQ ± SEM (n=5) and analyzed by one way ANOVA (P<0.001), followed by Tukey's test (P<0.05). In the figure, the groups with different letters are significantly different and those with the same letters are not significant. Control sample was taken as the calibrator.
Figure 6 Expression of pituitary FSHβ mRNA in control, ovariectomized and sham ovariectomized female catfish Heteropneustes fossilis (A) resting phase, (B) preparatory phase. Data were expressed as mean of Log RQ ± SEM (n=5) and analyzed by one way ANOVA (P<0.001), followed by Tukey's test (P<0.05). In the figure, the groups with different letters are significantly different and those with the same letters are not significant. Control sample was taken as the calibrator.
Figure 7 Expression of pituitary LHβ mRNA in control, ovariectomized and sham ovariectomized female catfish Heteropneustes fossilis (A) resting phase, (B) preparatory phase. Data were expressed as mean of Log RQ ± SEM (n=5) and analysed by one way ANOVA (P<0.001), followed by Tukey's test (P<0.05). In the figure, the groups with different letters are significantly different and those with the same letters are not significant. Control sample was taken as the calibrator.
Effects of E2 replacement on plasma steroids and GtH subunit gene expression
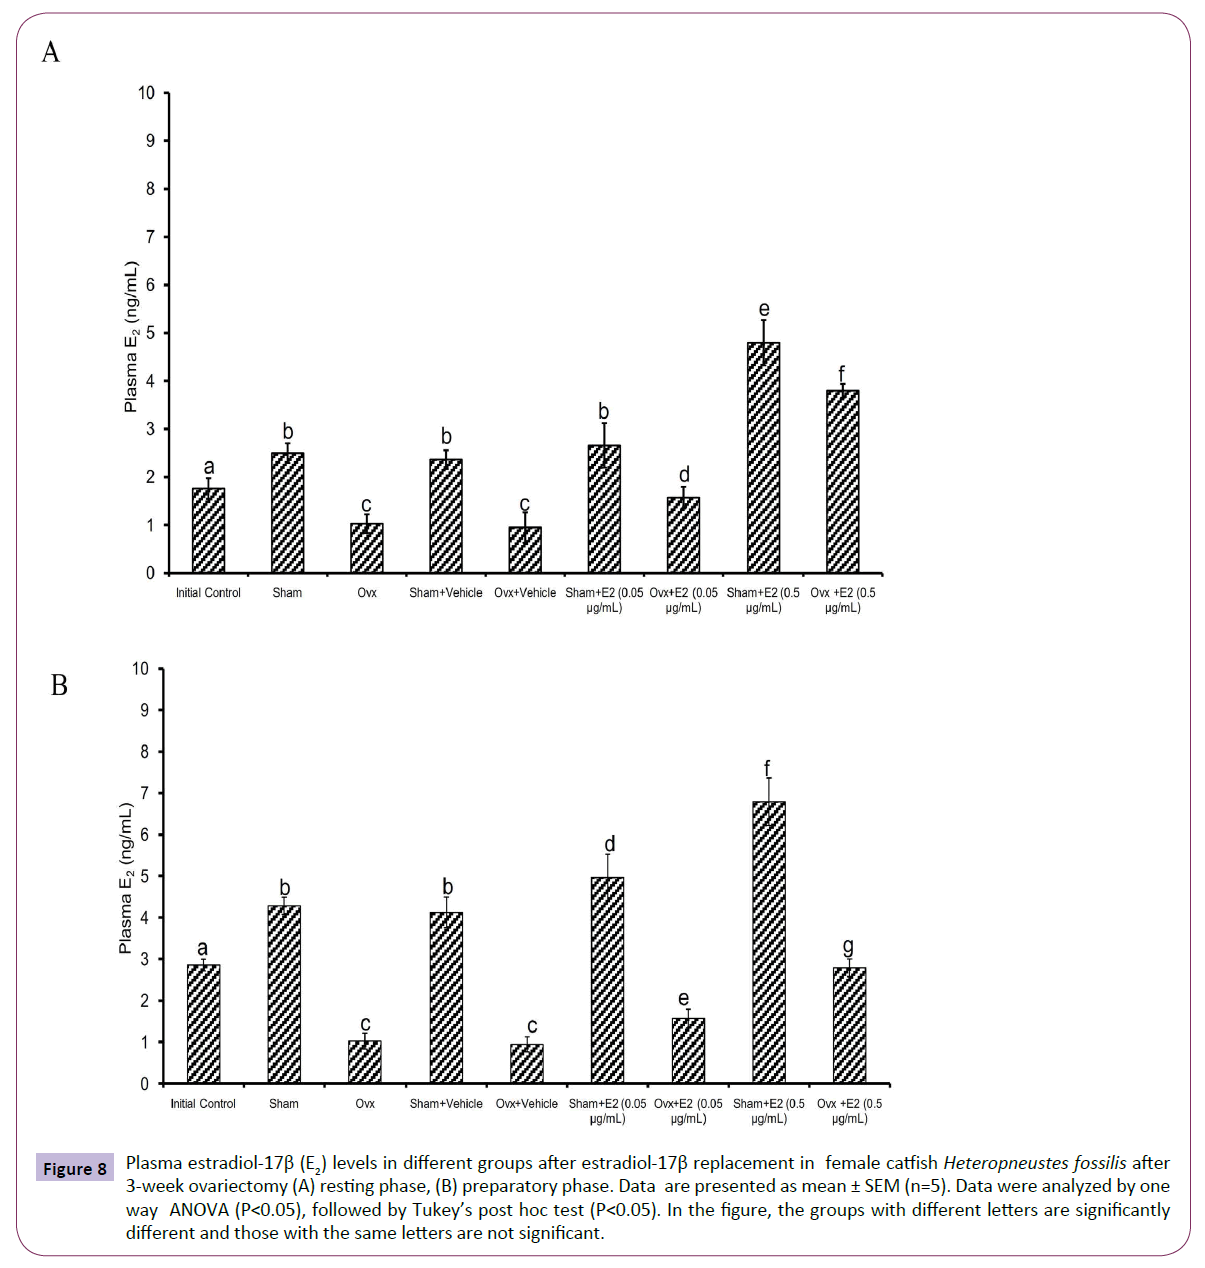
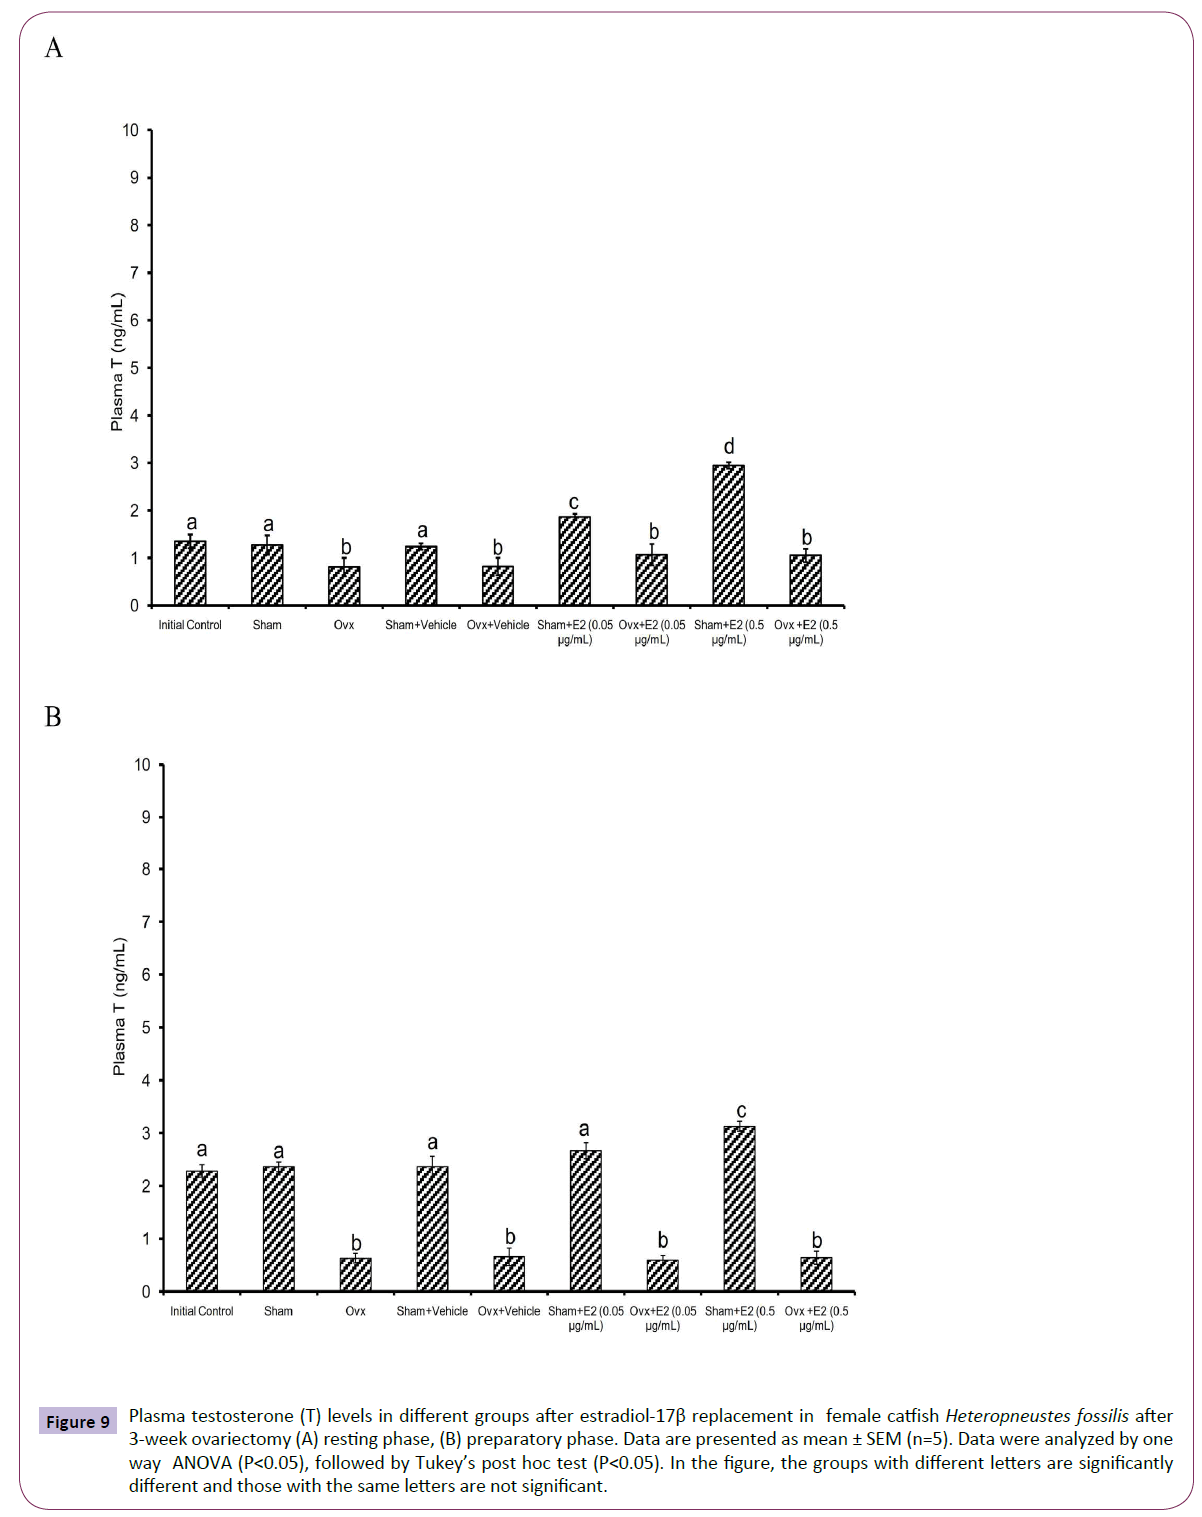
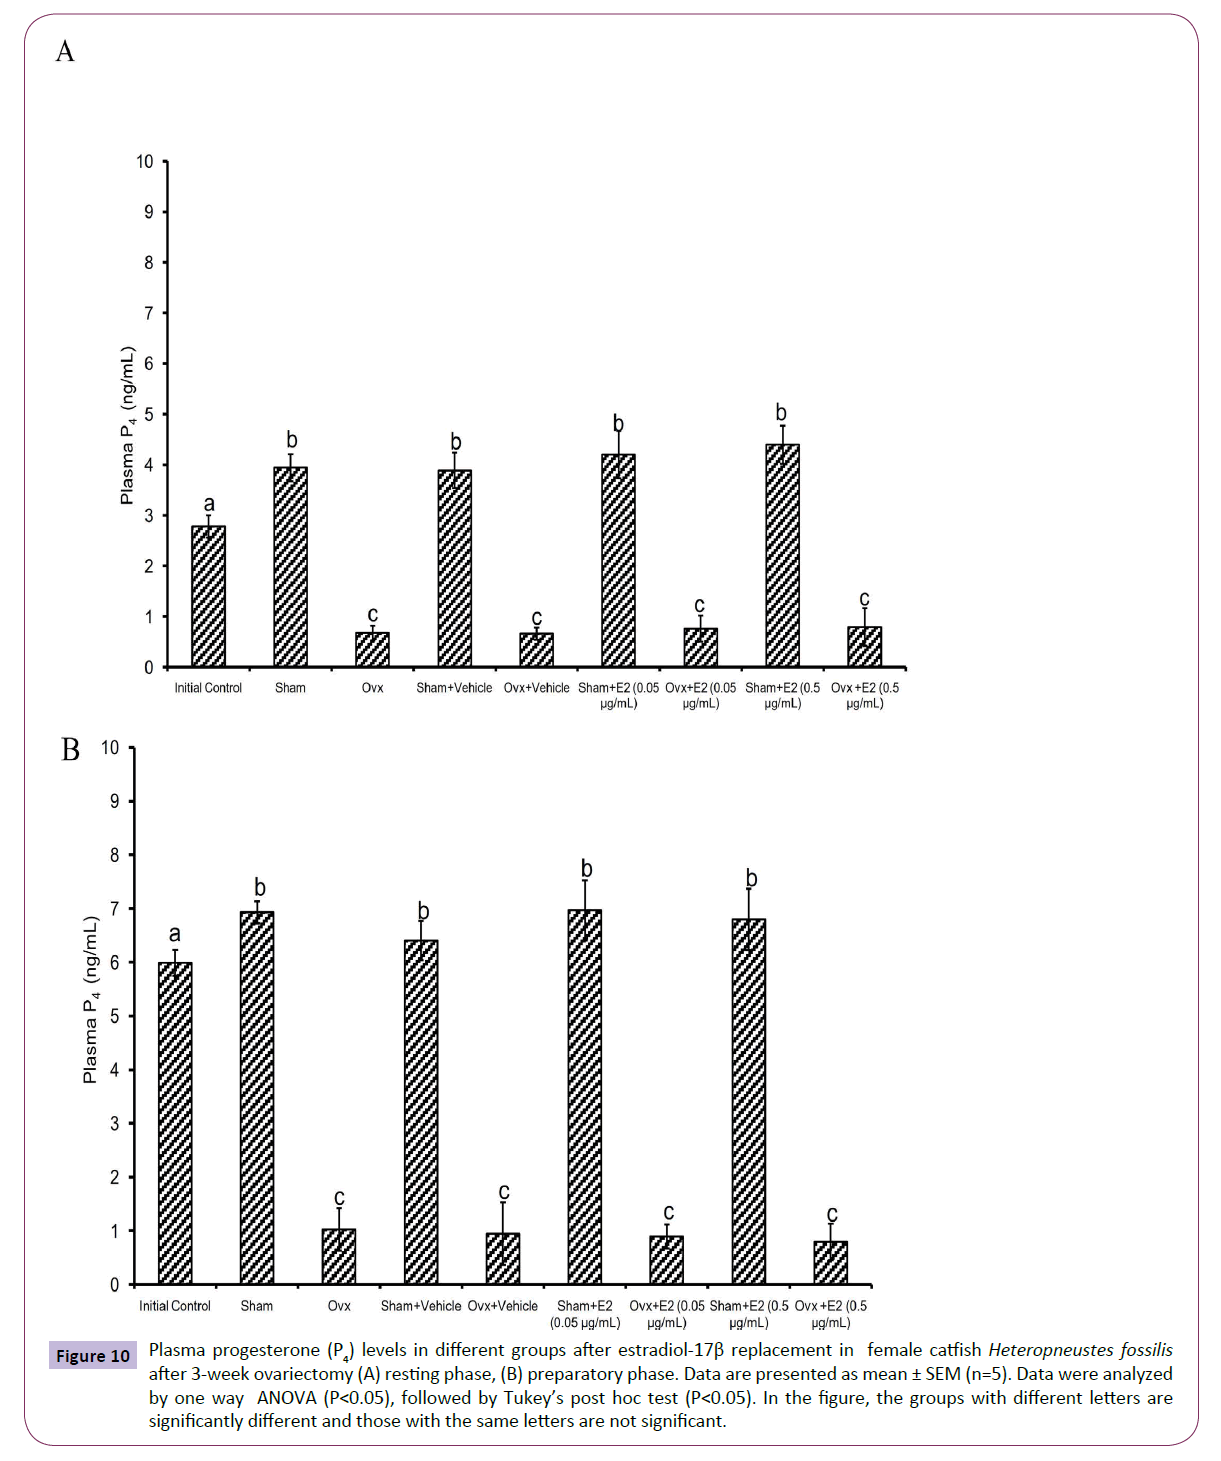
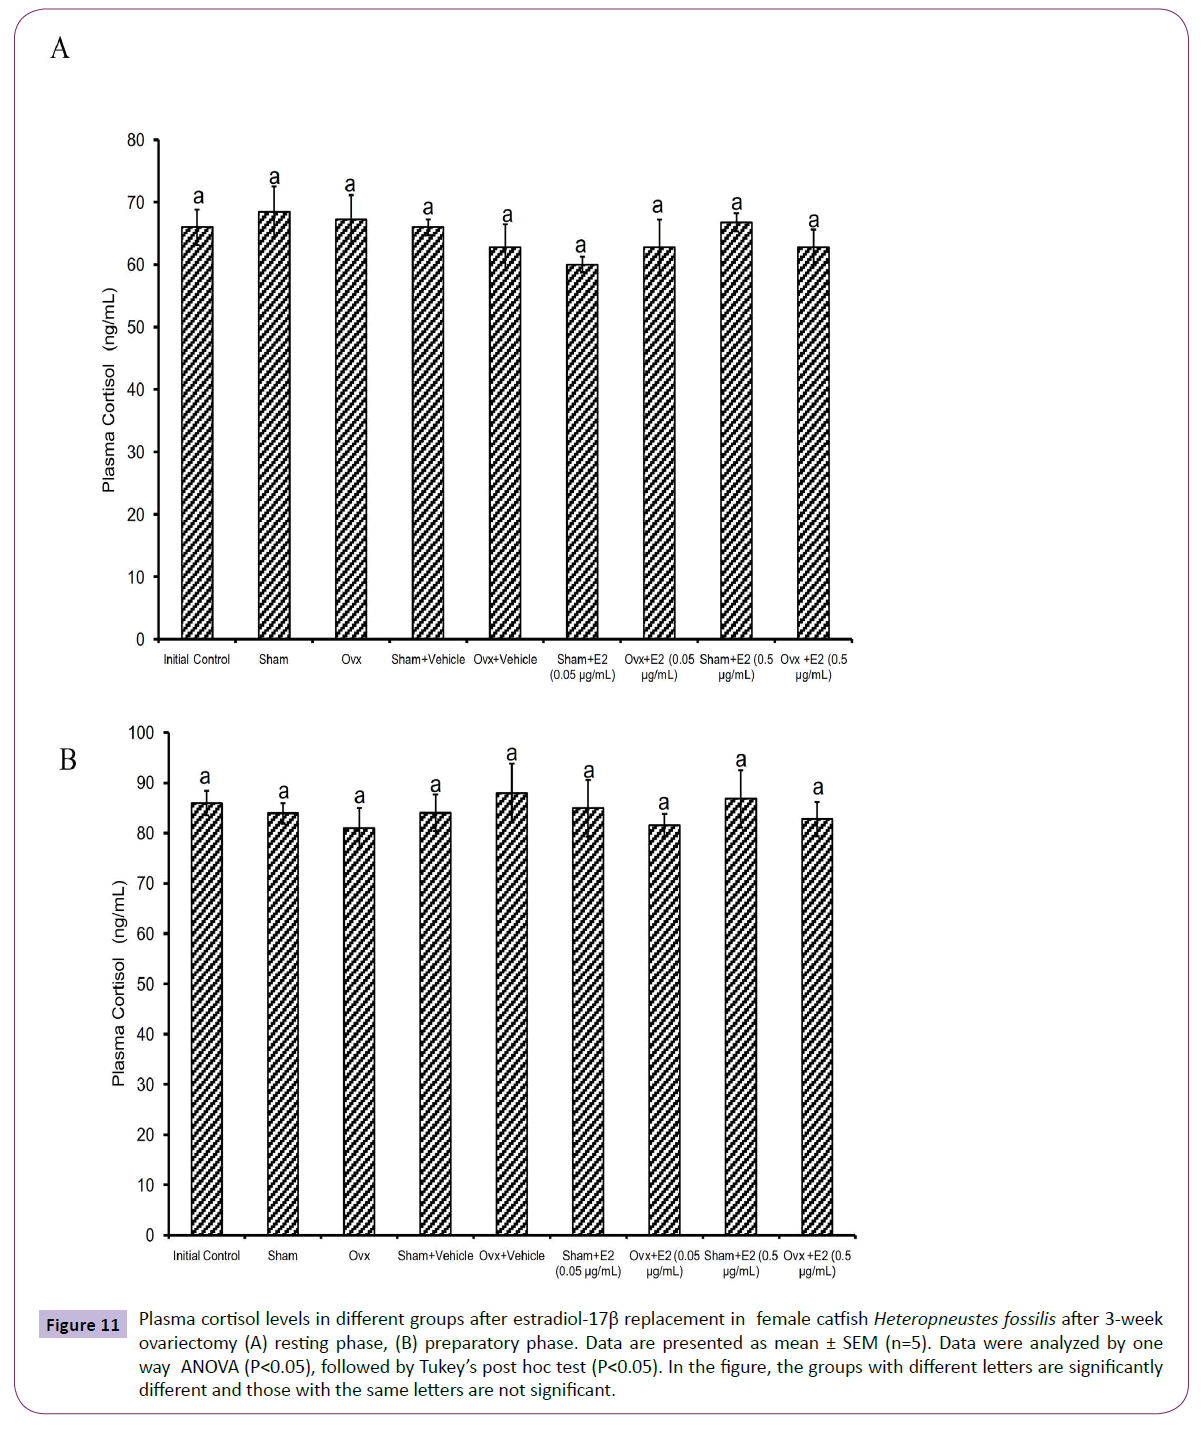
The E2 treatment in the 3-week OVX fish produced overall significant effects on plasma E2, testosterone and P4 levels (one way ANOVA, P<0.001,) in the resting (FE2=174.29, FTestosterone=96.85 and FP4=74.94 FCortisol=2.56) and preparatory (FE2=114.76, FTestosterone=123.65, FP4=56.19) phases. Plasma cortisol level did not show any significant effect after OVX. The E2 treatment elevated plasma E2 levels significantly in a dose-dependent manner in OVX groups compared to the vehicle control group (Figures 8A and 8B) in both phases. In the sham-OVX groups, plasma E2 level increased significantly only in the 0.5 μg group in the resting phase and in a dose-dependent manner in the preparatory phase. The E2 replacement did not alter testosterone (Figures 9A and 9B) and P4 (Figures 10A and 10B) levels in the OVX groups. The plasma testosterone level increased significantly in both 0.05 and 0.5 μg sham OVX groups in the resting phase but only in the 0.5 μg group in the preparatory phase. Plasma P4 levels did not vary significantly in the sham OVX groups (Figures 10A and 10B). Plasma level of cortisol did not vary significantly in any of the treatment groups (Figures 11A and 11B).
Figure 8 Plasma estradiol-17β (E2) levels in different groups after estradiol-17β replacement in female catfish Heteropneustes fossilis after 3-week ovariectomy (A) resting phase, (B) preparatory phase. Data are presented as mean ± SEM (n=5). Data were analyzed by one way ANOVA (P<0.05), followed by Tukey’s post hoc test (P<0.05). In the figure, the groups with different letters are significantly different and those with the same letters are not significant.
Figure 9 Plasma testosterone (T) levels in different groups after estradiol-17β replacement in female catfish Heteropneustes fossilis after 3-week ovariectomy (A) resting phase, (B) preparatory phase. Data are presented as mean ± SEM (n=5). Data were analyzed by one way ANOVA (P<0.05), followed by Tukey’s post hoc test (P<0.05). In the figure, the groups with different letters are significantly different and those with the same letters are not significant.
Figure 10 Plasma progesterone (P4) levels in different groups after estradiol-17β replacement in female catfish Heteropneustes fossilis after 3-week ovariectomy (A) resting phase, (B) preparatory phase. Data are presented as mean ± SEM (n=5). Data were analyzed by one way ANOVA (P<0.05), followed by Tukey’s post hoc test (P<0.05). In the figure, the groups with different letters are significantly different and those with the same letters are not significant.
Figure 11 Plasma cortisol levels in different groups after estradiol-17β replacement in female catfish Heteropneustes fossilis after 3-week ovariectomy (A) resting phase, (B) preparatory phase. Data are presented as mean ± SEM (n=5). Data were analyzed by one way ANOVA (P<0.05), followed by Tukey’s post hoc test (P<0.05). In the figure, the groups with different letters are significantly different and those with the same letters are not significant.
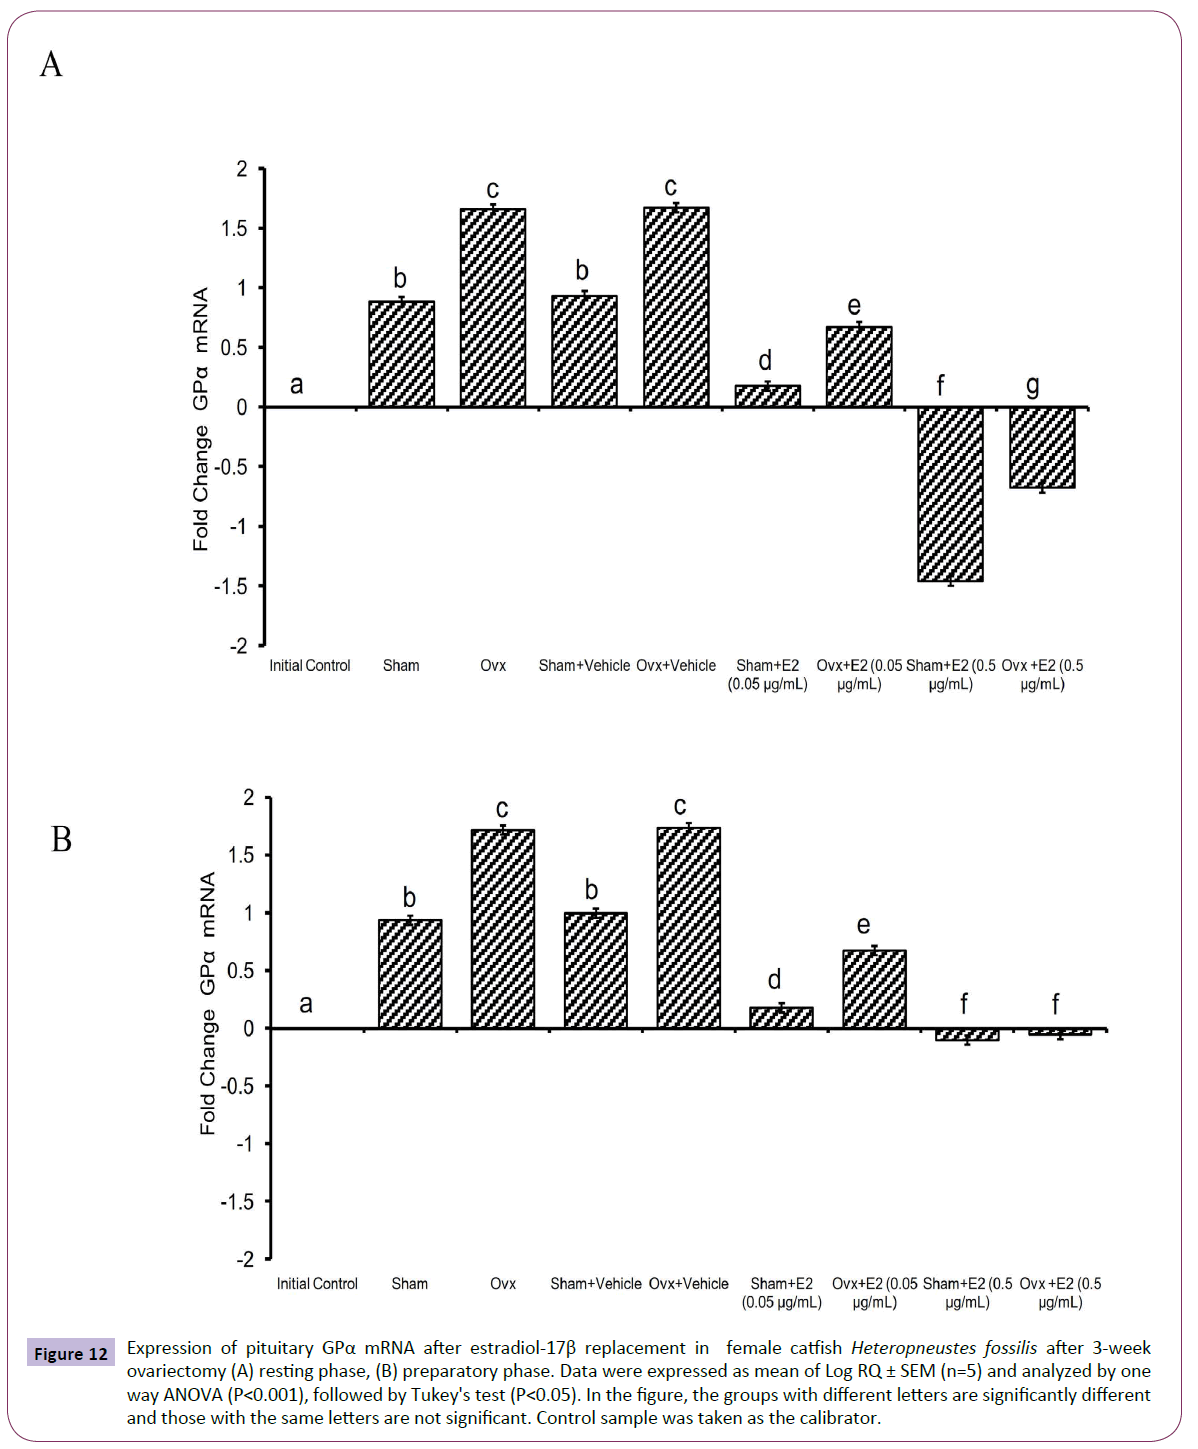
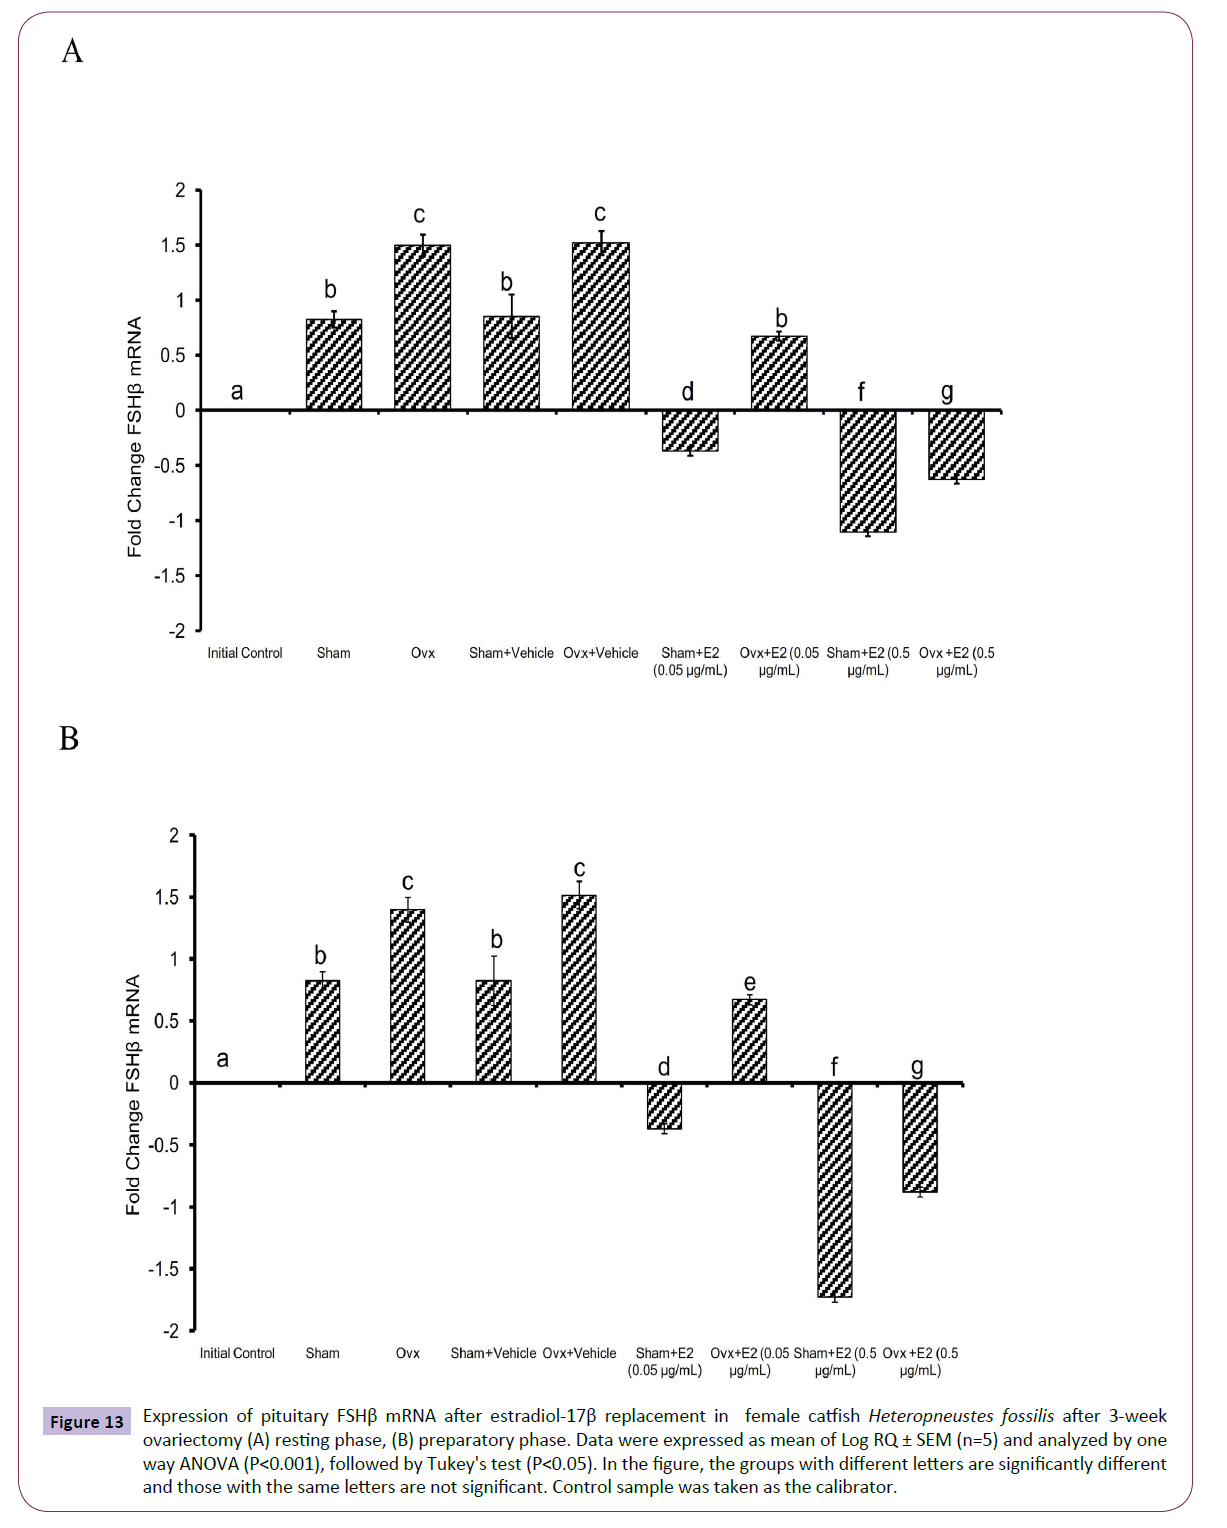
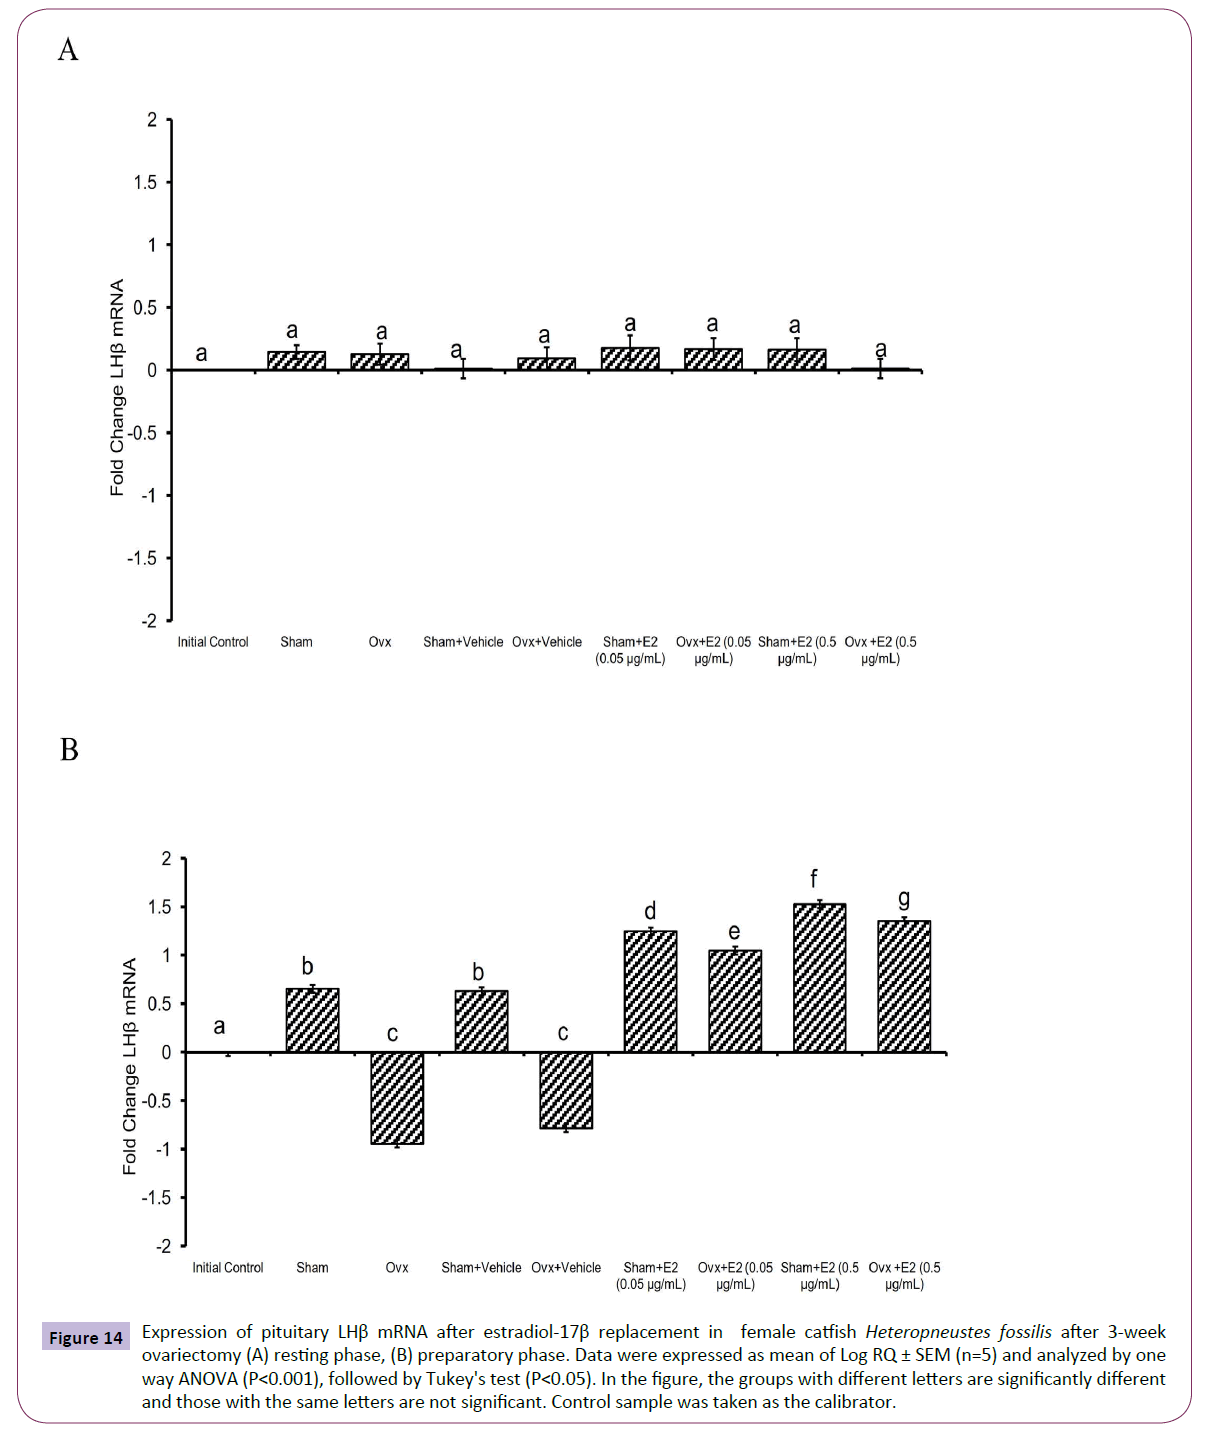
The administration of E2 showed significant effects on pituitary GPα, FSHβ and LHβ expression. In the resting (P<0.001, one way ANOVA, FGPα=747.22, FFSHβ=709.56 and FLHβ=3.68) and preparatory (P<0.001, one way ANOVA, FGPα=366.58, FFSHβ=743.82 and FLHβ=578.66) phases. The E2 replacement decreased the OVX-induced stimulation of GPα expression in a season-dependent manner. In the resting phase, the 0.05 μg E2 decreased the transcript levels compared to the OVX and sham control groups, and the 0.5 μg E2 inhibited the levels negatively below the base line, a greater inhibition in the sham group (Figures 12A and 12B). In the preparatory phase, the response was similar but the intensity of inhibition with the high dose was low compared to the resting phase values. The low E2 dose decreased the OVX-induced increase in the FSHβ transcript levels in both resting and preparatory phases (Figures 13A and 13B). However, the high E2 dose inhibited the transcript level below the basal line in the OVX groups in both phases; the inhibition was higher in the preparatory phase. In the sham groups, E2 inhibited FSHβ expression significantly below the basal level with a higher inhibition in the high E2 sham group. The inhibition was higher in the preparatory phase than that in the resting phase and in the sham groups than that in the OVX groups. The E2 replacement did not produce any significant change in the LHβ transcript levels in the resting phase (Figures 14A and 14B). In the preparatory phase, E2 treatment reversed the inhibition due to OVX and stimulated LHβ transcript levels above the basal level dose-dependently. In the sham E2 groups, the LHβ transcript levels increased over that of the sham vehicle group and higher than that in the OVX+E2 groups.
Figure 12 Expression of pituitary GPα mRNA after estradiol-17β replacement in female catfish Heteropneustes fossilis after 3-week ovariectomy (A) resting phase, (B) preparatory phase. Data were expressed as mean of Log RQ ± SEM (n=5) and analyzed by one way ANOVA (P<0.001), followed by Tukey's test (P<0.05). In the figure, the groups with different letters are significantly different and those with the same letters are not significant. Control sample was taken as the calibrator.
Figure 13 Expression of pituitary FSHβ mRNA after estradiol-17β replacement in female catfish Heteropneustes fossilis after 3-week ovariectomy (A) resting phase, (B) preparatory phase. Data were expressed as mean of Log RQ ± SEM (n=5) and analyzed by one way ANOVA (P<0.001), followed by Tukey's test (P<0.05). In the figure, the groups with different letters are significantly different and those with the same letters are not significant. Control sample was taken as the calibrator.
Figure 14 Expression of pituitary LHβ mRNA after estradiol-17β replacement in female catfish Heteropneustes fossilis after 3-week ovariectomy (A) resting phase, (B) preparatory phase. Data were expressed as mean of Log RQ ± SEM (n=5) and analyzed by one way ANOVA (P<0.001), followed by Tukey's test (P<0.05). In the figure, the groups with different letters are significantly different and those with the same letters are not significant. Control sample was taken as the calibrator.
Discussion
The present data show that both E2 exerts season-dependent differential effects on GtH subunit gene expression in the pituitary of the catfish. The time-dependent decrease in plasma E2 level, testosterone and P4 indicates that ovary is the major source of the steroids, as has been reported previously [35]. The E2 administration in the 3-week OVX groups caused a dosedependent increase in the E2 level but not in the testosterone or P4 level. Plasma cortisol level showed an increase in both OVX and sham OVX groups in week 1 and 2, the levels decreased to the control level subsequently. This suggests that the elevated cortisol level was due to stress of the operation, which subsided subsequently. The E2 replacement did not alter the cortisol level. The steroid profile indicated that OVX and the steroid administration affected the expression of GtH subunit genes. FSH and LH are the key hormones in the control of reproduction in vertebrates, regulating gonadal gametogenesis and steroidogenesis. Initially, it was believed that the pituitary of fish contained a single GtH, called maturational GtH, which regulated all processes of reproduction [38]. In recent years, it has been well established that fish have two GtHs, GtH-1 and GtH-2, and based on the nucleotide and amino acid sequence identity with their tetrapodan counterparts, the GtH-1 and GtH-2 were renamed as FSH and LH, respectively [39]. In salmonids, plasma FSH levels are high during the early stages of gametogenesis, decreasing during vitellogenesis and maturation, and rising again during the preovulatory period, whereas LH is undetectable during gametogenesis, increasing just before spermiation/ovulation [6,40-45]. Annual profiles of expression of their genes closely followed the plasma GtH levels [6,46] and further implicated FSH in the control of initiation and maintenance of gonadal growth, and LH in the regulation of final gonadal maturation and spermiation/ovulation, at least in salmonids. For several years, sufficient information has been accumulated on the regulation of LH secretion in fish [2], but very little is known about the FSH secretion in non-salmonids.
It has been also reported that at an early stage of gonadal development, a positive feedback of gonadal steroids also operate in fish; aromatizable androgens and estrogens activate LHβ gene expression and increase pituitary LH protein levels in juveniles of several species. The European eel is a noteworthy exception since androgens (including non-aromatizable ones), but not E2, stimulate LH gene expression [47]. In sexually mature medaka, gonadal steroids show negative feedback effects on FSHβ expression, but positive feedback effects on LHβ [48]. Real-time PCR analysis on the effect of gonadal steroids on FSHβ and LHβ expression showed that OVX increased FSHβ mRNA expression [48]. In contrast, OVX reduced LHβ mRNA expression. Both the treatments with E2 or 11-ketotestosterone (a nonaromatizable androgen) antagonized the effects of OVX [48]. These observations are also true for the female catfish. Female tilapia with vitellogenic ovary on being exposed to increasing doses of E2 in vivo, showed a dose-dependent decrease in mRNA levels of LHβ and FSHβ [20], probably due to the negative feedback of E2 on the expression of both subunit gene mRNA levels. The FSHβ level increased with dihydroprogesterone, most likely due to the recruitment of a new generation of oocytes for the new reproductive cycle [20]. Both testosterone and E2 decreased FSHβ transcripts in immature female Japanese eels [49]. In female European silver eels, testosterone treatment elicited a significant negative effect on FSHβ mRNA levels while the E2 treatment had no significant effect [50].
In the medaka it has been demonstrated that a kiss1 (Kisspeptin 1) neuronal population in nucleus ventral tuberis is positively regulated by ovarian estrogens, and thus may be involved in the positive feedback of the gonadotropic axis [21]. Evidence from mammals suggests that kisspeptin may be the primary molecule controlling steroidal regulation. Kisspeptin neurons are suggested to conserve estrogen sensitivity in a wide variety of vertebrates [22]. Circulating concentrations of E2 define the levels of Kiss1 mRNA expression in the female brain in a site-specific manner that appears to relate to the negative and positive feedback actions of this steroid. OVX stimulates Kiss1 expression in the arcuate nucleus of female mouse [51], rat [52] and ewe [53], while E2 replacement diminishes this effect. However, there has not been a clear evidence to suggest its importance in reproduction in non-mammalian species. Very recently, it was demonstrated that the kiss1 gene is not necessary for reproduction in the teleost medaka, unlike in mammals [54]. There are reports on the lack of gpr54-1 and gpr54-2 expression in GnRH neurons in several teleosts [23].
In the catfish, the E2 replacement reversed the effect of OVX (low dose) and even inhibited the expression (high dose). The E2 replacement had no effect on LHβ expression in the resting phase, but stimulated the expression in the preparatory phase. Previously in the catfish, OVX and E2 replacement strategies were used to understand the regulation of LH secretion [55]. OVX stimulated LH secretion and E2 replacement doses resulted in dose-dependent effects of plasma LH levels; stimulation at a very low dose (0.01 μg/g E2), no effect in medium doses (0. 05 μg/g) and inhibition at high doses (1 μg/g) [35]. Further studies have shown that the varied effects are attributed to differential effects of E2 on catecholaminergic activity [11,36]. A low E2 dose stimulated noradrenergic activity that stimulated LH secretion. A high E2 dose stimulated dopaminergic activity that inhibited LH secretion. Since there was no assays available for FSH in catfishes, E2 regulation of FSH secretion was not investigated in the previous study. The present study provided the first evidence of E2 control of FSHβ gene transcriptional activity. The data show that E2 negatively regulates FSHβ gene expression regardless of the gonadal status. The GPα expression was also similarly regulated. In contrast, OVX and E2 replacement did not elicit any effect on LHβ expression in the gonad-inactive phase. With the commencement of the breeding phase E2 exerts a stimulatory effect on the LHβ expression. The differential seasonal effect of E2 may be due to the temporal functional role of LH in gonadal activity. The previous and present study data when put together show a dynamic role of E2 on LHβ transcriptional activity and LH release.
The differences in the expression pattern of LHβ and FSHβ during the gonad-inactive and active phases may be due to different factors such as anatomical divergences in the distribution of gonadotropes, electrophysiology of the gonadotropes as well as the differences in the molecular architecture of the genes. The anatomic proximity of the FSH gonadotropes to the pituitary vasculature may be the route by which gonadal steroids directly signal the FSH-specific gonadotropes in teleosts [56]. Studies in Atlantic cod (Gadus morhua) showed that the FSH and LH gonadotropes exhibited differential regulation at the level of electrical activity. Excitable and quiescent gonadotropes are distinguishable through differences in excitability and Ca2+ influx acting via different ion channel repertoires [57]. Conserved smad-and GnRH-responsive steroidogenic factor1 (sf1) element has been identified in FSHβ promoters of goldfish [58] and tilapia and zebrafish [59]. The sf1 is placed adjacent to an estrogenresponsive site (EREs). Several other smad-binding sites and EREs have been found on FSHβ promoters in tilapia and zebrafish [59]. Interestingly, E2 inhibited sea bass FSHβ expression at the level of the pituitary involving an ERE-independent mechanism or the estrogen-dependent regulatory region may be upstream of the characterized fragment [60]. Zebrafish pituitary cell cultures showed the expression of nuclear androgen receptor and all three forms of nuclear estrogen receptors, strongly supporting a direct action for both androgens and estrogens at the pituitary level [61]. Although the ERE-like element is not necessary for the estradiol receptor α (ERα) to trigger the LHβ gene transcription in Chinook salmon, it plays an extremely important role in mediating GnRH effect due to the binding of GnRH-regulated c-jun to this element. c-Jun, on the other hand, plays a decisive part in mediating the GnRH effect, acting together with Sf-1 and Pitx1, while interacting physically with both proteins [62].
In conclusion, OVX and E2 replacement produced differential effects on GtH subunit gene expression in the catfish [63]. OVX stimulated GPα and FSHβ expression in both gonad quiescent and recrudescent phases. The LHβ expression was either not affected (resting phase) or inhibited (preparatory phase). This indicates that FSHβ expression is negatively regulated by the ovary (E2) in both phases. The LHβ expression was not sensitive to steroid levels in the resting phase [64]. In contrast, during early stage of ovarian growth, the LH expression is positively regulated by E2 since OVX led to an inhibition of the gene expression [65]. Whether the relationship holds true in the later phase of ovary growth (oocyte maturation and ovulation) is to be investigated.
Acknowledgment
The research work was supported by a grant of Department of Science and Technology, New Delhi (grant No. SA/SO/AS- 43/2009) awarded to KPJ and RC. The first author is grateful to the Council of Scientific and Industrial Research, New Delhi for Junior and Senior Research Fellowships.
References
- Fostier A, Jalabert B, Billard R, Breton B, Zohar Y (1983) The Gonadal Steroids, In: Hoar, WS, Randall, DJ, Donaldson EM(eds.) Fish Physiol.Volume 9, Part A, Academic Press, pp: 277-372.
- Trudeau VL (1997) Neuroendocrine regulation of gonadotrophin II release and gonadal growth in the goldfish, Carassius auratus. Rev Reprod2:55-68.
- Dickey JT, Swanson P (1998) Effects of sex steroids on gonadotropin (FSH and LH) regulation in coho salmon (Oncorhynchus kisutch). J Mol Endocrin 21: 291-306.
- Antonopoulou E, Bornestaf C, Swanson P, Borg B(1999a)Feedback control of gonadotropins in Atlantic Salmon, Salmo salar, male Parr: I. Castration effects in rematuring and nonrematuring Fish. Gen Comp Endocr 114: 132-141.
- Antonopoulou E, Swanson P, Mayer I, Borg B (1999b) Feedback control of gonadotropins in Atlantic salmon, Salmo salar, male parr: II. Aromatase inhibitor and androgen effects. Gen Comp Endocr 114:142-150.
- Gomez JM, Weil C, Ollitrault M, Le Bail PY, Breton B, et al. (1999) Growth hormone (GH) and gonadotropin subunit gene expression and pituitary and plasma changes during spermatogenesis and oogenesis in rainbow trout (Oncorhynchus mykiss). Gen Comp Endocr 113: 413-428.
- Yaron Z, Gur G, Melamed P, Rosenfeld H, Elizur A, et al. (2003) Regulation of fish gonadotropins. Int Rev Cytol 225: 131-185.
- Zohar Y, Muñoz-Cueto JA, Elizur A, Kah O (2010) Neuroendocrinology of reproduction in teleost fish. Gen Comp Endocr 165:438-455.
- de Leeuw R, Wurth YA, Zandbergen MA, Peute J, Goos HJ (1986a) The effects of aromatizable androgens, non-aromatizable androgens, and estrogens on gonadotropin release in castrated African catfish, Clarias gariepinus (Burchell): A physiological and ultrastructural study. Cell Tissue Res 243: 587-594.
- Kobayashi M, Stacey NE (1990) Effects of ovariectomy and steroid hormone implantation on serum gonadotropin levels in female goldfish. Zool Sci 7: 715-721.
- Senthilkumaran B, Joy KP (1996) Effects of administration of some monoamine-synthesis blockers and precursors on ovariectomy-induced rise in plasma gonadotropin II in the catfish Heteropneustes fossilis. Gen Comp Endocr 101: 220-226.
- Khan IA, Thomas P (1999) GABA exerts stimulatory and inhibitory influences on gonadotropin II secretion in the Atlantic croaker (Micropogonias undulatus). Neuroendocrinology 69: 261-268.
- Mateos J, Mananos E, Carrillo M, Zanuy S (2002) Regulation of follicle-stimulating hormone (FSH) and luteinizing hormone (LH) gene expression by gonadotropin-releasing hormone (GnRH) and sexual steroids in the Mediterranean sea bass. Comp Biochem Phys B 132:75-86.
- Klenke U, Zohar Y (2003) Gonadal regulation of gonadotropin subunit expression and pituitary LH protein content in female hybrid striped bass. Fish Physiol Biochem 28: 25-27.
- Bommelaer MC, Billard R, Breton B (1981) Changes in plasma gonadotropin after ovariectomy and estradiol supplementation at different stages at the end of the reproductive cycle in the rainbow trout (Salmo gairdneri R.). Reprod Nutr Dev 21: 989-997.
- Larsen DA, Swanson P (1997) Effects of gonadectomy on plasma gonadotropins I and II in coho salmon, Oncorhynchus kisutch. Gen Comp Endocr 108: 152-160.
- de Leeuw R, Goos HT, Van Oordt, PGWJ (1986b) The dopaminergic inhibition of the gonadotropin-releasing hormone-induced gonadotropin release: an in vitro study with fragments and cell suspensions from pituitaries of the African catfish, Clarias gariepinus (Burchell). Gen Comp Endocr 63: 171-177.
- Peter RE, Chang JP, Nahorniak CS, Omeljaniuk RJ, Sokolowska M, et al. (1986) Interactions of catecholamines and GnRH in regulation of gonadotropin secretion in teleost fish. Recent Prog Horm Res 42: 513-548.
- de Leeuw R, Goos HJTh, Van Oordt PGWJ (1987) The regulation of gonadotropin release by neurohormones and gonadal steroids in the African catfish, Clarias gariepinus. Aquaculture 63: 43-58.
- Levavi-Sivan B, Biran J, Fireman E (2006) Sex steroids are involved in the regulation of gonadotropin-releasing hormone and dopamine D2 receptors in female tilapia pituitary. Biol Reprod 75: 642-650.
- Kanda S, Akazome Y, Matsunaga T, Yamamoto N, Yamada S, et al. (2008) Identification of KiSS-1 product kisspeptin and steroid-sensitive sexually dimorphic kisspeptin neurons in medaka (Oryzias latipes). Endocrinology 149: 2467-2476.
- Kanda S, Karigo T, Oka Y (2012) Steroid Sensitive kiss2 neurones in the goldfish: Evolutionary insights into the duplicate kisspeptin gene-expressing neurones. J Neuroendocrinol 24: 897-906.
- Kanda S, Oka Y (2013) Structure, synthesis, and phylogeny of kisspeptin and its receptor. In: Kauffman AS and Smith JT (eds.) "Kisspeptin Signaling in Reproductive Biology", Springer, New York, pp: 9-26
- Navas JM, Anglade I, Bailhache T, Pakdel F, Breton B, et al. (1995) Do gonadotrophin-releasing hormone neurons express estrogen receptors in the rainbow trout? A double immunohistochemical study. J Comp Neurol 363: 461-474.
- Linard B, Anglade I, Corio M, Navas JM, Pakdel F, et al. (1996) Estrogen receptors are expressed in a subset of tyrosine hydroxylase-positive neurons of the anterior preoptic region in the rainbow trout. Neuroendocrinology 63: 156-165.
- Shi Y, Zhang YLS, Liu Q, Lu D, Liu M, et al.(2010) Molecular identification of the Kiss2/Kiss1ra system and its potential function during 17a-methyltestosterone-induced sex reversal in the orange spotted grouper, Epinephelus coioides.Biol Reprod 83: 63-74.
- Servili A, Le Page Y, Leprince J, Caraty A, Escobar S, et al. (2011) Organization of two independent kisspeptin systems derived from evolutionary-ancient kiss genes in the brain of zebrafish. Endocrinology 152: 1527-1540.
- Xiong F, Liu D, Ledrean Y, Elsholtz HP, Hew CL (1994b) Differential recruitment of steroid-hormone response elements may dictate the expression of the pituitary gonadotropin II b subunit gene during salmon maturation. Mol Endocrinol 8: 782-793.
- Rosenfeld H, Levavi-Sivan B, Gur G, Melamed P, Meiri I, et al. (2001) Characterization of tilapia FSHß gene and analysis of its 5' flanking region. Comp Biochem Phys B 129: 389-398.
- Schulz RW, Zandbergen MA, Peute J, Bogerd J, van Dijk W, et al. (1997) Pituitary gonadotrophs are strongly activated at the beginning of spermatogenesis in African catfish, Clarias gariepinus. Biol Reprod 57: 139-147.
- Chaube R, Joy KP, Acharjee A (2015) Catfish gonadotrophins: cellular origin, structural properties and physiology. J Neuroendocrinol 6:536-543.
- Vischer HF, Teves ACC, Ackermans JCM, van Dijk W, Schulz RW, et al. (2003) Cloning and spatiotemporal expression of follicle-stimulating hormone b subunit complementary DNA in the African catfish (Clarias gariepinus). Biol Reprod68: 1324-1332.
- Kumar RS, Trant JM (2004) Hypophyseal gene expression profiles of FSH-b, LH-b and glycoprotein hormone-a subunits in Ictalurus punctatus throughout a reproductive cycle. Gen Comp Endocr136: 82-89.
- Wu F, Zhang X, Zhang W, Huang B, Liu Z, et al. (2009) Expression of three gonadotropin subunits in Southern catfish gonad and their possible roles during early gonadal development. Comp Biochem Phys A 153: 44-48.
- Senthilkumaran B, Joy KP (1994) Effects of photoperiod alterations on hypothalamic serotonin content and turnover, and monoamine oxidase activity in the female catfish, Heteropneustes fossilis (Bloch). Fish Physiol Biochem13: 301-307.
- Senthilkumaran B, Joy KP (1995) Changes in hypothalamic catecholamines, dopamine-ß-hydroxylase and phenylethanolamine-N-methyltranserase in the catfish Heteropneustes fossilis in relation to season, raised photoperiod and temperature, ovariectomy and estradiol-17ß replacement. Gen Comp Endocr 97: 121-134.
- Acharjee A, Chaube R, Joy KP (2015) Molecular cloning and characterization of the gonadotropin subunits GPa, FSHß, and LHß genes in the stinging catfish Heteropneustes fossilis: Phylogeny, seasonal expression and pituitary localization. J EXP Zool Part A: EcolGene Physiol 323: 567-585.
- Burzawa-Gerard E (1982) Chemical data on pituitary gonadotropins and their implication to evolution. Canadian J Fish Aqua Sci 39: 80-91.
- Quérat B (1994) Molecular evolution of the glycoprotein hormones in vertebrates. In: Davey KG, Peter RE, Tobe SS (eds.) "Perspectives in Comparative Endocrinology", National Research Council Canada, Ottawa, Canada, pp: 27-35.
- Swanson P, Suzuki K, Kawauchi H, Dickhoff WC (1991) Isolation and characterization of two coho salmon gonadotropins. GtH-I and GtH-II. Biol Reprod 44: 29-38.
- Slater CH, Schreck CB, Swanson P (1994) Plasma profiles of the sex steroids and gonadotropins in maturing female spring Chinook salmon (Oncorynchus tshawytscha). Comp Biochem Physiol 109: 165-175.
- Prat F, Sumpter JP, Tyler CR (1996) Validation of radioimmunoassays for two salmon gonadotropins (GTH I and GTH II) and their plasma concentrations throughout the reproductive cycle in male and female rainbow trout (Oncorhynchus mykiss). Biol Reprod 54: 1375-1382.
- Breton B, Govoroun M, Mikolajczyk T (1998) GTH I and GTH II secretion profiles during the reproductive cycle in female rainbow trout: relationship with pituitary responsiveness to GnRH-A stimulation. Gen Comp Endocr111: 38-50.
- Bon E, Breton B, Govoroun M, Menn F (1999) Effects of accelerated photoperiod regimes on the reproductive cycle of the female rainbow trout: II seasonal variations of plasma gonadotropins (GTH I and GTH II) levels correlated with ovarian follicle growth and egg size. Fish Physiol Biochem20: 143-154.
- Vacher C, Mananos EL, Breton B, Marmignon MH, Saligaut C (2000) Modulation of pituitary dopamine D1 or D2 receptors and secretion of follicle stimulating hormone and luteinizing hormone during the annual reproductive cycle of female rainbow trout. J Neuroendocrinol 12: 1219-1226.
- Weil C, Bougoussa-Houadec M, Gallais C, Itoh S, Sekine S, et al. (1995) Preliminary evidence suggesting variations of GtH 1 and GtH 2 mRNA levels at different stages of gonadal development in rainbow trout, Oncorhynchus mykiss. Gen Comp Endocr100: 327-333.
- Huang YS, Schmitz M, Le Belle N, Chang CF, Querat B, et al. (1997) Androgens stimulate gonadotropin-II ß-subunit in eel pituitary cells in vitro. Mol Cell Endocrinol131: 157-166.
- Kanda S, Okubo K, Oka Y (2011) Differential regulation of the luteinizing hormone genes in teleosts and tetrapods due to their distinct genomic environments–Insights into gonadotropin beta subunit evolution. Gen Comp Endocr173: 253-258.
- Jeng SR, Yueh WS, Chen GR, Lee YH, Dufour S, et al. (2007) Differential expression and regulation of gonadotropins and their receptors in the Japanese eel, Anguilla japonica. Gen Comp Endocr154: 161-173.
- Schmitz M, Aroua S, Vidal B, Le Belle N, Elie P, et al. (2005) Differential regulation of luteinizing hormone and follicle-stimulating hormone expression during ovarian development and under sexual steroid feedback in the European eel. Neuroendocrinology 81: 107-119.
- Smith JT, Cunningham MJ, Rissman, EF, Clifton DK, Steiner RA (2005) Regulation of Kiss1 gene expression in the brain of the female mouse. Endocrinology 146: 3686-3692.
- Smith JT, Popa SM, Clifton DK, Hoffman GE, Steiner RA (2006) Kiss1 neurons in the forebrain as central processors for generating the preovulatory luteinizing hormone surge. J Neurosci26: 6687-6694.
- Smith JT, Clay CM, Caraty A, Clarke IJ (2007) KiSS-1 messenger ribonucleic acid expression in the hypothalamus of the ewe is regulated by sex steroids and season. Endocrinology 148: 1150-1157.
- Takahashi A, Kanda S, Akazome Y, Oka Y (2015) FRI-425: Functional analysis of kisspeptin neuronal system in teleosts using knockout medaka. Endocrine Society's 97th Annual Meeting and Expo, March 5-8, San Diego.
- Joy KP (1997) Catfish pituitary gonadotropes and regulation of gonadotropin secretion In: Singh BR (ed.) "Advances in Fish Research" Vol II. Narendra Publishing House, New Delhi, pp: 221-232.
- Golan M, Zelinger E, Zohar Y, Levavi-Sivan B (2015) Architecture of GnRH-gonadotrope-vasculature reveals a dual mode of gonadotropin regulation in fish. Endocrinology 156: 4163-4173.
- Hodne K, Strandabø RA, von Krogh K, Nourizadeh-Lillabadi R, Sand O, et al. (2013) Electrophysiological differences between fshb-and lhb-expressing gonadotropes in primary culture. Endocrinology 154:3319-3330.
- Lau MT, Lin SW, Ge W (2012) Identification of smad response elements in the promoter of goldfish FSH beta gene and evidence for their mediation of activin and GnRH stimulation of FSH beta expression. Front Endocrin3:47.
- Golan M, Biran J, Levavi-Sivan B (2014) A novel model for development, organization, and function of gonadotropes in fish pituitary. Front Endocrin 5:182.
- Muriach B, Carrillo M, Zanuy S, Cerdá-Reverter JM (2014) Characterization of sea bass FSHß 5' flanking region: transcriptional control by 17ß-estradiol. Fish Physiol Biochem 40:849-864.
- Lin SW, Ge W (2009) Differential regulation of gonadotropins (FSH and LH) and growth hormone (GH) by neuroendocrine, endocrine, and paracrine factors in the zebrafish—an in vitro approach. Gen Comp Endocr160:183-193.
- Melamed P, Zhu YH, Tan SH, Xie M, Koh M (2006) Gonadotropin-releasing hormone activation of c-jun, but not early growth response factor-1, stimulates transcription of a luteinizing hormone beta-subunit gene. Endocrinology 147: 3598-3605.
- Levavi-Sivan B, Bogerd J, Mañanós EL, Gómez A, Lareyre JJ (2010) Perspectives on fish gonadotropins and their receptors. Gen Comp Endocr165: 412-437.
- Mazón MJ, Gómez A, Yilmaz O, Carrillo M, Zanuy S (2014) Administration of follicle-stimulating hormone in vivo triggers testicular recrudescence of juvenile European sea bass (Dicentrarchus labrax). Biol Reprod9:1-10.
- Rosenfeld H, Meiri I, Elizur A (2007) Gonadotropic regulation of oocyte development: from basic studies to biotechnological applications. In: Babin PJ, Cerdà J, Lubzens E (eds.) "The Fish Oocyte", Springer, The Netherlands, pp: 175-202.
Open Access Journals
- Aquaculture & Veterinary Science
- Chemistry & Chemical Sciences
- Clinical Sciences
- Engineering
- General Science
- Genetics & Molecular Biology
- Health Care & Nursing
- Immunology & Microbiology
- Materials Science
- Mathematics & Physics
- Medical Sciences
- Neurology & Psychiatry
- Oncology & Cancer Science
- Pharmaceutical Sciences
